by peripato » Thu 25 Feb 2010, 06:35:32
$this->bbcode_second_pass_quote('OilFinder2', 'W')ell well well. Lookee what we have here.
We were told less than a year ago that the credit crunch would kill oil projects and non-OPEC was past peak and about to decline precipitously.
$this->bbcode_second_pass_quote('', 'B')arclays Capital saw a potential drop of 1.5 million bpd, or 3 percent of non-OPEC supply, and a 70 percent price rise from current levels to $85/bbl in 2010. Deutsche Bank saw a 280,000 bpd decline this year.
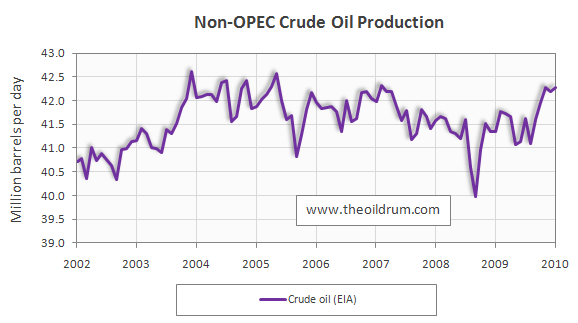
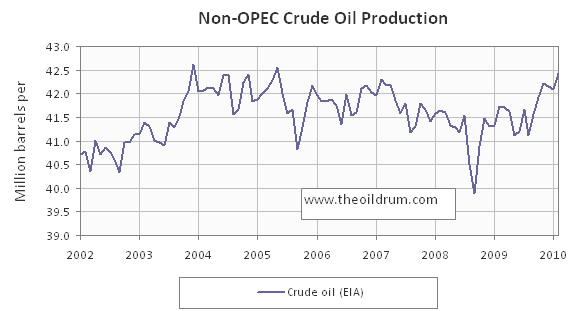
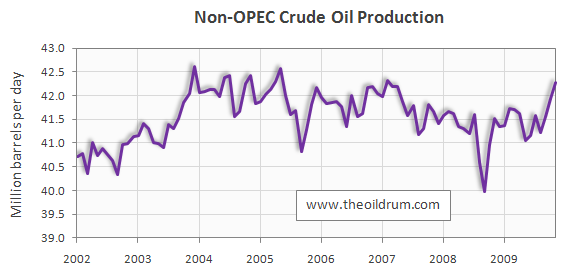
But look what we have instead? Interesting leg up at the end there - no? Non-OPEC is less than a half-million bpd from a new record. According to the Prophets, this wasn't supposed to be possible!
Looks like they handed OilFinger's head to him on a platter over at TOD about his empty rhetoric. He posts as
abundance.concept there you know.
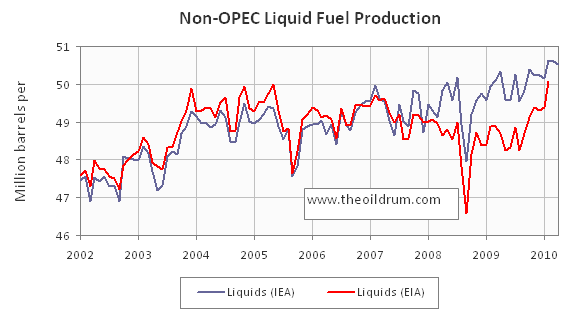
abundance.concept on February 24, 2010 - 9:31pm Well well well. Whadya know? Less than a year ago, we were told non-OPEC liquids production was supposed to be somewhere around 44 mbpd by now. But the chart at the top of the page shows us somewhere around 49 mbpd. It just gets curiouser and curiouser! In fact . . .
Non OPEC-12 oil production peaked in 2004 at 46.8 million barrels/day (mbd) shown in the chart below. This oil definition includes crude oil, lease condensate, oil sands and natural gas plant liquids.
. . . being around 49 mbpd, not only does that forecast leave something to be desired, but we are now in record territory (at least according to the IEA).
Reply | Reply in new window | Start new thread | Flag as inappropriate (?)
toilforoil on February 24, 2010 - 10:52pm No, we were told less than a year ago that OIL production was supposed to be at some level. Then oil production was defined. After you've checked out the IEA's definition of liquids and have some numbers for the products included therein, especially those not included in Ace's definition, please come back with your report.
While you're at it, why don't you work out the amount of liquids production, which is used for liquids production. See any trends there?
thanks in advance for your efforts to set your record straight.
Reply | Reply in new window | Start new thread | Flag as inappropriate (?)
abundance.concept on February 24, 2010 - 11:40pm You are correct, I should have compared the same categories. I saw the NGL's in ace's first chart and thought it meant all-liquids.
At any rate, I wonder if ace is still willing to maintain his prediction in the other thread:
Do you think that non OPEC-12 crude oil, lease condensate and oil sands production has passed its peak five years ago in 2004 at 42.1 mbd?
My answer to that question is, No.
Reply | Reply in new window | Start new thread | Flag as inappropriate (?)
WebHubbleTelescope on February 25, 2010 - 2:31am abundance.concept,
Do you care to back that up? I suppose that you have some sort of model that you can use to substantiate your claim.
After a while, it gets pretty tiresome to hear these empty assertions. Show us your concept of abundance please.
Abundance.
That word will come up in my next TOD posting. Watch for it, the concept I have brewing looks like a breakthrough.