Donate Bitcoin

Donate Paypal


PeakOil is You

PeakOil is You

Dont worry, be happy

General discussions of the systemic, societal and civilisational effects of depletion.

Dont worry, be happy

Postby spot5050 » Sun 18 Nov 2007, 20:29:30

Here's the classic PO chart...

Image

Scary huh.

But look at the horizontal axis... it spans a timescale of about 300 years.

What would that chart look like if we zoomed in on the peak and used a more human timescale... say 40 years - half an average human lifetime.

Image

Now the "peak" of Peak Oil has disappeared and been replaced by a rather gentle slope.

Zoom in again so the horizontal axis spans only ten years and the so-called "peak" becomes almost completely flat.

Of course, PO is hugely significant but it will take time to get over the peak. Calculating exactly which year PO will occur is an academic excercise.
spot5050
Tar Sands
Tar Sands
 
Posts: 518
Joined: Tue 07 Dec 2004, 04:00:00
Location: Cheshire, England

Re: Dont worry, be happy

Postby dohboi » Sun 18 Nov 2007, 20:37:45

Flat, or nearly flat, production is a crisis in itself, in a world that has accustomed itself to ever-increasing quantities of the black fluid and in a world with economies as large and rapidly growing as those of China and India. Yes, we can't know for sure how rapid the fall off will be, but you don't even have to get to the downside of the curve for severe "adjustments" to start setting in, as we are now seeing.

But thanks for the reminder that graphs look very different presented at different magnifications. Always an important point to keep in mind.
User avatar
dohboi
Harmless Drudge
Harmless Drudge
 
Posts: 19990
Joined: Mon 05 Dec 2005, 04:00:00

Re: Dont worry, be happy

Postby americandream » Sun 18 Nov 2007, 20:51:23

Now take this PO graph and overlay on it a chart for projected economic growth across the world (note..Chindia is an unstoppable juggernaut of 2 billion people in overdrive)....and tremble.
americandream
Permanently Banned
 
Posts: 8650
Joined: Mon 18 Oct 2004, 03:00:00

Re: Dont worry, be happy

Postby Twilight » Sun 18 Nov 2007, 21:05:58

Classic PO chart? No it isn't. What's up with the vertical scale? What region is that? If 40 years a human timscale, why does the relevant section begin in 1979? Why don't we choose 1930 and show 40 years of exponential growth? How about we start off with 2007 and show the next 40 years? That's what's relevant. It won't look pretty under any magnification.
Twilight
Expert
Expert
 
Posts: 3027
Joined: Fri 02 Mar 2007, 04:00:00

Re: Dont worry, be happy

Postby Don35 » Sun 18 Nov 2007, 21:41:14

Nice, but the down slope will be MUCH steeper than the up slope. It's called exponentially growing demand. Plus the easy "fruit" has been picked. What's left? Tar sands, shale, deep ocean oil, etc. Still looks scary to me!
Everybody thinks they're righteous! Adam Baldwin "Jayne" Firefly/Serenity
User avatar
Don35
Peat
Peat
 
Posts: 195
Joined: Tue 07 Feb 2006, 04:00:00

Re: Dont worry, be happy

Postby billp » Sun 18 Nov 2007, 22:36:06

Senior does not know.

Senior was scared by 1972 and 1980 oil problems.

Is 2007 different?

Maybe history is different?

http://www.prosefights.org/nmlegal/dcvo ... tm#history

Who knows?
User avatar
billp
Coal
Coal
 
Posts: 414
Joined: Sun 11 Dec 2005, 04:00:00
Location: albuquerque

Re: Dont worry, be happy

Postby Heineken » Sun 18 Nov 2007, 22:55:22

The time period for the part of the curve you've chosen to zoom in on---1979 to 2017---is three-fourths over. So your analysis is highly misleading.

Zoom in, instead, on the 40-year period from 2008 to 2048 (that is, the 40-year period we all start living in a few weeks). That curve is much less gentle and much more scary.

p.s.: Twilight, I see you've said pretty much the same thing.
"Actually, humans died out long ago."
---Abused, abandoned hunting dog

"Things have entered a stage where the only change that is possible is for things to get worse."
---I & my bro.
User avatar
Heineken
Expert
Expert
 
Posts: 7051
Joined: Tue 14 Sep 2004, 03:00:00
Location: Rural Virginia

Re: Dont worry, be happy

Postby Judgie » Sun 18 Nov 2007, 23:30:01

http://www.peakoilblues.com/blog/

So? which variation of Panglossian disorder do we diagnose Spot5050 with?
"That the cream cannot help but always rise up to the top, well I say, <censored by peakoil.com> floats"

Jarvis Cocker - "Running the World"
Judgie
Coal
Coal
 
Posts: 418
Joined: Mon 07 May 2007, 03:00:00
Location: Adelaide, South Australia

Re: Dont worry, be happy

Postby yeahbut » Mon 19 Nov 2007, 00:33:00

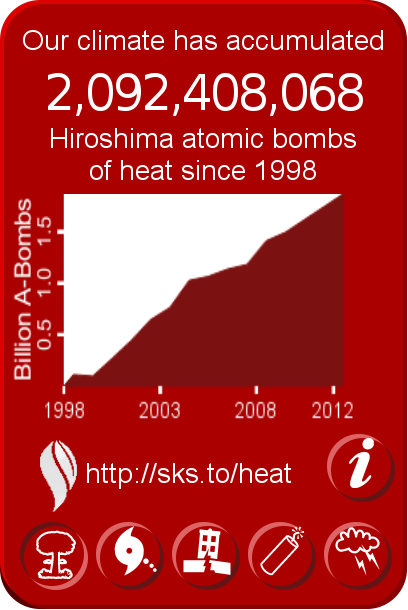
$this->bbcode_second_pass_quote('americandream', 'N')ow take this PO graph and overlay on it a chart for projected economic growth across the world (note..Chindia is an unstoppable juggernaut of 2 billion people in overdrive)....and tremble.


Most charts for projected economic growth are likely to have been conceived of in that bizarre, blinkered void that nearly all economists seem to inhabit-the one where natural resources are considered to be just another economic input. They certainly won't have been conceived of with the thought that stuff runs out, or that economies will ever do anything other than grow, long-term. Therefore, they are practically irrelevant when considering the future of world energy demand.
If you accept that a massive increase in the price of oil, and therefore everything else, is an inevitable consequence of PO, then any orthodox economic projections of Chindia's(and anyone else's)future growth are bound to be wildly off the mark. If stuff gets really expensive and times really get hard, real depression hard, everyone's consumption is going to go way down. You don't spend too much time at the mall during a depression, you're too busy competing with guys with PhDs for ditch digging jobs. And that goes double, triple for poorer countries. See how long the juggernauts last when no ones buying what they're selling.
Decreased demand seems to be discounted by many here at PO as a mitigating factor for the steepness of the far side of the curve. It strikes me as a real contradiction-how can the massive crash predicted by the doomers not be accompanied by a massive drop in consumption? Wouldn't they go hand in hand?
User avatar
yeahbut
Tar Sands
Tar Sands
 
Posts: 819
Joined: Tue 30 Oct 2007, 03:00:00

Re: Dont worry, be happy

Postby jupiters_release » Mon 19 Nov 2007, 00:39:47

$this->bbcode_second_pass_quote('spot5050', '
')Image


Whatever this is, it has nowt to do with oil.

Thanks for wasting another thread.
jupiters_release
Heavy Crude
Heavy Crude
 
Posts: 1301
Joined: Mon 10 Oct 2005, 03:00:00

Re: Dont worry, be happy

Postby whereagles » Mon 19 Nov 2007, 19:55:05

$this->bbcode_second_pass_quote('spot5050', 'Z')oom in again so the horizontal axis spans only ten years and the so-called "peak" becomes almost completely flat.


I see where you're getting at, but, if you speak like that, it just seems that you're amazed by having rediscovered the concept of a "manifold", e.g. something that locally seems FLAT :p
User avatar
whereagles
Tar Sands
Tar Sands
 
Posts: 586
Joined: Wed 17 Aug 2005, 03:00:00
Location: Portugal

Re: Dont worry, be happy

Postby Heineken » Mon 19 Nov 2007, 21:03:12

Hey, make the x-axis span only ten days and curve gets even flatter!!

What's the point?

The entire thesis is idiocy.
"Actually, humans died out long ago."
---Abused, abandoned hunting dog

"Things have entered a stage where the only change that is possible is for things to get worse."
---I & my bro.
User avatar
Heineken
Expert
Expert
 
Posts: 7051
Joined: Tue 14 Sep 2004, 03:00:00
Location: Rural Virginia

Re: Dont worry, be happy

Postby spot5050 » Mon 19 Nov 2007, 22:04:15

$this->bbcode_second_pass_quote('dohboi', 'F')lat, or nearly flat, production is a crisis in itself, in a world that has accustomed itself to ever-increasing quantities of the black fluid and in a world with economies as large and rapidly growing as those of China and India. Yes, we can't know for sure how rapid the fall off will be, but you don't even have to get to the downside of the curve for severe "adjustments" to start setting in, as we are now seeing.

I think the word "crisis" is too strong. Yes flat production will necessitate an adjustment for business and the financial markets in particular, but there have been several recent episodes of flat and even falling output and I'm sure you would agree that whilst it wasn't pleasant, the world did not end. Flat output will only really come as a big shock for people who are too young to remember the last recession!

$this->bbcode_second_pass_quote('Twilight', 'C')lassic PO chart? No it isn't. What's up with the vertical scale? What region is that?

My mistake. I forgot to put the scale on the vertical axis - it should say "World Oil Production - billion barrels per year"

$this->bbcode_second_pass_quote('Twilight', 'I')f 40 years a human timscale, why does the relevant section begin in 1979? Why don't we choose 1930 and show 40 years of exponential growth? How about we start off with 2007 and show the next 40 years? That's what's relevant. It won't look pretty under any magnification.

I chose those dates because they span the peak. Neither of the ranges you suggest - 1930 to 1970 or 2007 to 2047 span the peak.

$this->bbcode_second_pass_quote('Don35', 'N')ice, but the down slope will be MUCH steeper than the up slope. It's called exponentially growing demand.

Yes apparently the experts believe that the down slope will be steeper that the up slope. That can be seen in the first chart.

$this->bbcode_second_pass_quote('Heineken', 'H')ey, make the x-axis span only ten days and curve gets even flatter!!

What's the point?

The entire thesis is idiocy.

Ten days is not a big part of my life, but 40 years is.

My point is that according to the published data, it will take half a lifetime to get over the peak. If you think that it will take 10 days to get over the peak, then the peak is a very scary and short term immediate issue for you. But it just isn't going to happen like that.

The change from ever increasing oil production to declining will take (according to the published data) years or even decades.
spot5050
Tar Sands
Tar Sands
 
Posts: 518
Joined: Tue 07 Dec 2004, 04:00:00
Location: Cheshire, England
Top

Re: Dont worry, be happy

Postby spot5050 » Tue 20 Nov 2007, 00:05:53

$this->bbcode_second_pass_quote('yeahbut', 'D')ecreased demand seems to be discounted by many here at PO as a mitigating factor for the steepness of the far side of the curve. It strikes me as a real contradiction - how can the massive crash predicted by the doomers not be accompanied by a massive drop in consumption? Wouldn't they go hand in hand?

Yes they have to. By definition we can't consume more oil than we produce.

Doomers and economists are equally guilty of wrong-headed thinking. Economists will not accept that oil is a finite resource and doomers will not accept that we live in a world driven by economics. Both are convinced that they own the future.
spot5050
Tar Sands
Tar Sands
 
Posts: 518
Joined: Tue 07 Dec 2004, 04:00:00
Location: Cheshire, England
Top

Re: Dont worry, be happy

Postby seldom_seen » Tue 20 Nov 2007, 00:40:55

$this->bbcode_second_pass_quote('spot5050', '')$this->bbcode_second_pass_quote('yeahbut', 'h')ow can the massive crash predicted by the doomers not be accompanied by a massive drop in consumption? Wouldn't they go hand in hand?

Yes they have to. By definition we can't consume more oil than we produce.

The part that you are leaving out is that we live in a growth based economy. Like an airplane, it has to keep moving forward or it crashes.

When the economy completely stalls, or actually starts to contract. All the "economic models" can be thrown out the window. This will sink the entire banking system. We're seeing the early developments of that now.

A peak oil induced recession/depression does not mitigate peak oil, or smooth out the downslope. It crashes economies.

If you're standing in a bread line someday you won't be saying "I'm sure glad this economic depression reduced demand for oil."
seldom_seen
Intermediate Crude
Intermediate Crude
 
Posts: 2229
Joined: Tue 12 Apr 2005, 03:00:00
Top

Re: Dont worry, be happy

Postby TonyPrep » Tue 20 Nov 2007, 01:25:58

$this->bbcode_second_pass_quote('spot5050', 'I') think the word "crisis" is too strong. Yes flat production will necessitate an adjustment for business and the financial markets in particular, but there have been several recent episodes of flat and even falling output and I'm sure you would agree that whilst it wasn't pleasant, the world did not end. Flat output will only really come as a big shock for people who are too young to remember the last recession!
That's quite a few people. However, the difference is that there is no future point, to look forward to, when oil production will exceed the peak. With other fossil fuel peaks not too far out, either, this means energy (and, in particular, transport energy) will decline and the economies of the world will never recover without huge adjustment in how they operate. Maybe you think they can adjust and we can settle to a business as usual state, at some point in the future. That is just wishful thinking.$this->bbcode_second_pass_quote('spot5050', 'I') chose those dates because they span the peak. Neither of the ranges you suggest - 1930 to 1970 or 2007 to 2047 span the peak.
But so do the dates 2000-2040, so why not choose that? As others have pointed out, though maybe you didn't pick up on it, most of the period you chose is gone and so of little relevance to the futures of people alive today.$this->bbcode_second_pass_quote('spot5050', 'M')y point is that according to the published data, it will take half a lifetime to get over the peak.
What do you mean by "get over". If peak was in 2005 or 2006 (depending on the type of liquids which are important) then we are already over it. If you mean before it becomes noticeable, where have you been for the last year? Whilst consumption cannot exceed supply, demand certainly can.$this->bbcode_second_pass_quote('spot5050', 'T')he change from ever increasing oil production to declining will take (according to the published data) years or even decades.
No, it will take a lot less than that. What "data" do you have for future production levels? If peak was last year, we've already declined, and your statement would then be blatantly wrong. If we end up with an undulating plateau, for a while, that will represent a real decline in either consumption per capita or desired consumption per capita (to feed economic growth).
User avatar
TonyPrep
Intermediate Crude
Intermediate Crude
 
Posts: 2842
Joined: Sun 25 Sep 2005, 03:00:00
Location: Waiuku, New Zealand
Top

Re: Dont worry, be happy

Postby Geko45 » Tue 20 Nov 2007, 02:44:44

I'm not sure where Spot5050 got his chart from, but it's certainly not an oil production curve. For one, it doesn't show the distinctive dip that occured in the 70s. My analysis (using the Hubbert method) shows a much more pronounced shortfall between supply and demand beginning very soon. With "regular" demand growth being about 1.9% per year according to the EIA, once peak is reached, demand and available supply diverge quite rapidly. Toss in the Export Land phenomenon and things get very bad very quick for net oil importers.

Image

And when we zoom in on the relevant time frame we see:

Image
Last edited by Geko45 on Tue 20 Nov 2007, 13:06:32, edited 1 time in total.
Geko45 - Producer of Doomer Porn
User avatar
Geko45
Tar Sands
Tar Sands
 
Posts: 639
Joined: Thu 28 Jul 2005, 03:00:00
Location: Houston, TX

Re: Dont worry, be happy

Postby spot5050 » Tue 20 Nov 2007, 03:26:47

$this->bbcode_second_pass_quote('Geko45', 'A')nd when we zoom in on the relevant time frame we see:

Image

Interesting chart Geko.

It is flat at the top... which is exactly my point.

The "peak" isn't a peak - it's an era taking many years.

Where did you get that data Geko?
spot5050
Tar Sands
Tar Sands
 
Posts: 518
Joined: Tue 07 Dec 2004, 04:00:00
Location: Cheshire, England
Top

Re: Dont worry, be happy

Postby spot5050 » Tue 20 Nov 2007, 03:58:03

Gawd, I am struggling to get across a very simple point.

I chose the dates for the charts at the start of this thread because they spanned the predicted peak of peak oil.

Please feel free to start another thread to discuss oil production from 1940-1970, or 2000-2150, or any other timespan, but I am only interested in +/- 20 years from now for the purposes of this thread.
spot5050
Tar Sands
Tar Sands
 
Posts: 518
Joined: Tue 07 Dec 2004, 04:00:00
Location: Cheshire, England

Re: Dont worry, be happy

Postby TonyPrep » Tue 20 Nov 2007, 04:56:06

$this->bbcode_second_pass_quote('spot5050', 'I') am only interested in +/- 20 years from now for the purposes of this thread.
So why didn't you pick 1987 to 2027? And why do you think other people would be interested in the last 20 years, rather than the next 40? Perhaps you'd like to re-graph and explain your interest in only 20 years into the future. What do you think the effects of a slight decline in oil supply might be over 20 years?

By the way, try using a decline of 3% per year from now (roughly what the EWG report foresaw) and work out what that means for 20 years time.
User avatar
TonyPrep
Intermediate Crude
Intermediate Crude
 
Posts: 2842
Joined: Sun 25 Sep 2005, 03:00:00
Location: Waiuku, New Zealand
Top

Next

Return to Peak Oil Discussion

Who is online

Users browsing this forum: No registered users and 3 guests

cron