Donate Bitcoin

Donate Paypal


PeakOil is You

PeakOil is You

Production vs. consumption chart, with world events

Discuss research and forecasts regarding hydrocarbon depletion.

Production vs. consumption chart, with world events

Unread postby Gazzatrone » Fri 10 Nov 2006, 14:46:44

Well the Title speaks for itself, but I thought I'd picturise the info from EIA's consumption/production XLS with global events thrown in.

Image

I find it interesting that Production Rates are predominantly below Consumption Rates. I wonder if this would change if I used the Yearly averages instead of the Daily averages.

Also intersting is the "Stepping Stone" effect in Consumption. As From 1983, Consumption never goes down, but levels then picks up again.

{Title edited to reflect thread content by Shannymara - hope your toes heal!}
THE FUTURE IS HISTORY!
User avatar
Gazzatrone
Tar Sands
Tar Sands
 
Posts: 581
Joined: Mon 07 Nov 2005, 04:00:00
Location: London, UK

Re: Things To Do When You Have Broken Toes

Unread postby Novus » Sat 11 Nov 2006, 01:57:34

The most shocking thing about any of the oil charts that show recent data is the fact that we now consume 8 MBPD more oil today than we did on 9/11. You would think 9/11 of all things would wake people up and maybe things would start to change. Not only are we using more oil the tend is accelerating.
User avatar
Novus
Intermediate Crude
Intermediate Crude
 
Posts: 2450
Joined: Tue 21 Jun 2005, 03:00:00

Re: Things To Do When You Have Broken Toes

Unread postby PWALPOCO » Sat 11 Nov 2006, 07:49:47

Wow , nice graph !

It really brings it home how much pressure has been put on the people in hard hats and overalls out in the deserts , on the oil rigs , and all the other unpleasant trouble spots , just to keep the black stuff flowing.

Its quite apparent we are totally addicted to the stuff and in ever increasing amounts. Sure weve had our moments (sometimes lasting years) when times are hard and weve not needed as much , but we recouperate , and we go on to use even more oil !

Its obvious that with the way things are going that if we lived in a world of infinite oil wed happily keep that consumption total rising ... over the last 20 years its roughly just shy of 1mbd. But we dont live in a world with infinite oil and by all accounts existing sources are dwindling and new production seems set to keep us at our current production levels.

In another thread is a graph showing us the "Export" peak ! And thats where things get very distressing ! Sure the first 50million out of 85 million barrels each day are consumed at home where it was made , but the last 35 million is transported elsewhere to get gobbled up. That 35mbd wedge is going to start getting thinner ...... apparently right about now !

So where do you live ? In a country that has oil at home , or do you rely on getting a bit of that 35mbd wedge ? Or perhaps youre a mix of the two ? For some people , peak oil may as well be now.

Paul
All that it takes for evil to triumph is for good men to do nothing.
User avatar
PWALPOCO
Lignite
Lignite
 
Posts: 296
Joined: Sun 02 Oct 2005, 03:00:00
Location: North Wales , UK

Re: Things To Do When You Have Broken Toes

Unread postby sameu » Sun 12 Nov 2006, 08:34:44

'windows 98 released' :lol:
User avatar
sameu
Tar Sands
Tar Sands
 
Posts: 579
Joined: Thu 18 Aug 2005, 03:00:00
Location: Belgium, Europe

Re: Things To Do When You Have Broken Toes

Unread postby Gazzatrone » Sun 12 Nov 2006, 09:11:35

$this->bbcode_second_pass_quote('sameu', ''')windows 98 released' :lol:


I should have expanded on that and put XP as well it seems coupled with the release of Xp came a fall in the price of PC component technology, again allowing greater use of the PC at home. Hence the wider use of the Internet, and Internet shopping. ALL adding to the consumption of energy.

I didn't add this but your Windows 98 comment made me look again. in 2002 you can see a sharp increase in consumption. Call it coincidence, but its a pretty strange coincidence if it is one.

P.S Note there was no mention of Windows ME. I had to interrupt the updates to install XP.
THE FUTURE IS HISTORY!
User avatar
Gazzatrone
Tar Sands
Tar Sands
 
Posts: 581
Joined: Mon 07 Nov 2005, 04:00:00
Location: London, UK

Re: Things To Do When You Have Broken Toes

Unread postby shortonoil » Sun 12 Nov 2006, 09:12:35

Novus said:

$this->bbcode_second_pass_quote('', 'N')ot only are we using more oil the tend is accelerating.


Not for long! The world has hit peak debt, which is what fueled (pun intended) this skyrocketing consumption phenomena. In the US, the average home owner now owes more on their house than the house is worth! This is occurring not only in the US, but from the UK to Australia; worldwide. The US’s $47 trillion bond debt is the end of the road. Investors world wide are backing away from US assets; the US now has a negative cash flow of about $3 billion per month. Peak Oil will show up first in the monetary/financial system, and it is very apparently here now; if anyone just wants to take a look.
User avatar
shortonoil
False ETP Prophet
False ETP Prophet
 
Posts: 7132
Joined: Thu 02 Dec 2004, 04:00:00
Location: VA USA

Re: Things To Do When You Have Broken Toes

Unread postby PWALPOCO » Sun 12 Nov 2006, 09:45:25

I quite liked the "Windows" references funnily enough , mainly because I can remember the sorts of things I was getting up to back then when those versions came out.

Secondly I did consider the point that PC use was starting to become more mainstream , the internet , albeit via dial up modems and so on made home PC use more common. Just consider the amount of extra power generation it must added on to keep all those PCs running, let alone all the resources gobbled up to make those PCs in the first place.


Paul
All that it takes for evil to triumph is for good men to do nothing.
User avatar
PWALPOCO
Lignite
Lignite
 
Posts: 296
Joined: Sun 02 Oct 2005, 03:00:00
Location: North Wales , UK

Re: Production vs. consumption chart, with world events

Unread postby AirlinePilot » Mon 13 Nov 2006, 14:17:08

Someone please answer why consumption can be ahead of production so much on that chart. Is it possible that there were enough reserves in storage to account for this obvious anomaly?

Its just not intuitive to me. It almost seems like those two lines are labeled wrong. Very interested in why that is.
User avatar
AirlinePilot
Moderator
Moderator
 
Posts: 4378
Joined: Tue 05 Apr 2005, 03:00:00
Location: South of Atlanta

Re: Production vs. consumption chart, with world events

Unread postby grink1tt3n » Mon 13 Nov 2006, 16:13:48

$this->bbcode_second_pass_quote('Gideon', '')$this->bbcode_second_pass_quote('shortonoil', 'I')n the US, the average home owner now owes more on their house than the house is worth!


Short on Oil - Cite?

[s]I'd really love to have a cite on this proposition. This is the first I've heard of this, and it's compelling.[/s]

Edit: After wasting 2 minutes searching, I realized that there is absolutely no way that this proposition can be true. I recall a statistic that something like 30-40% of homeowners own their house outright.

In any event, the stat is not only wrong, it's "way wrong".


Perhaps he meant new home owners (2003-2006). I don't know.
User avatar
grink1tt3n
Peat
Peat
 
Posts: 134
Joined: Sat 28 Oct 2006, 03:00:00
Location: Southern California

Re: Production vs. consumption chart, with world events

Unread postby FoxV » Mon 13 Nov 2006, 16:15:36

$this->bbcode_second_pass_quote('Gideon', 'S')hort on Oil - Cite?

Just in the neigbourhood so I'll grab this one if you don't mind Short'

August - Existing
September - New
September - Existing

Although it is a bit of an exaggeration to say that the average home owner is under water. Only the people that bought with 0% down or maxed out their heloc in the last year are underwater.

I don't know what that works out to in total numbers, but I believe that 20% of all sales in 2005/2006 are 0% down ARMs (about 3mil mortgages nationally)

I haven't been able to get details on how many people are now entering HELOC hell :evil:

in anycase, you should have some nice dents in your graph over the next couple of years Gazz'. This housing bust is nothing like the early 90's (which you didn't mark on your graph)
Angry yet?
FoxV
Heavy Crude
Heavy Crude
 
Posts: 1321
Joined: Wed 02 Mar 2005, 04:00:00
Location: Canada
Top

Re: Production vs. consumption chart, with world events

Unread postby Gazzatrone » Mon 13 Nov 2006, 18:15:50

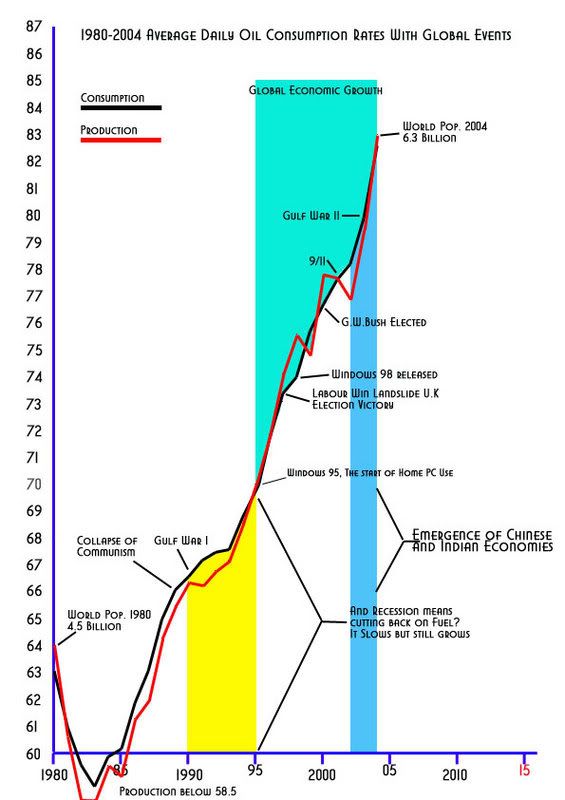
$this->bbcode_second_pass_quote('AirlinePilot', 'S')omeone please answer why consumption can be ahead of production so much on that chart. Is it possible that there were enough reserves in storage to account for this obvious anomaly?

Its just not intuitive to me. It almost seems like those two lines are labeled wrong. Very interested in why that is.


Well when I was doing the graph I put the Consumption rate in first. If you look at the title it just says Consumption rates. The Production line was a throw in as I have broken toes and am PC bound at home and was bored. I posted not realising I hadn't edited the title.

So trust me when I say I am not deliberately fabricating the data.

I was surprised when drawing out the Production line how far behind consumption production actual was.

Now admittedly this graph is based on average daily consumption/production rates but over all I believe they equal themselves out and you get a true picture. But it is interesting to note that for the majority of both averages run a parallel course.
THE FUTURE IS HISTORY!
User avatar
Gazzatrone
Tar Sands
Tar Sands
 
Posts: 581
Joined: Mon 07 Nov 2005, 04:00:00
Location: London, UK
Top

Re: Production vs. consumption chart, with world events

Unread postby Gazzatrone » Mon 13 Nov 2006, 18:19:18

$this->bbcode_second_pass_quote('FoxV', '')$this->bbcode_second_pass_quote('Gideon', '
')
in anycase, you should have some nice dents in your graph over the next couple of years Gazz'. This housing bust is nothing like the early 90's (which you didn't mark on your graph)


Yeh there were quite a few things I forgot to put in, but History gets pretty busy towards the end of the 20thC. besides I have plenty of time to make other graphs while my toes mend.

Watch This Space!
THE FUTURE IS HISTORY!
User avatar
Gazzatrone
Tar Sands
Tar Sands
 
Posts: 581
Joined: Mon 07 Nov 2005, 04:00:00
Location: London, UK
Top

Re: Production vs. consumption chart, with world events

Unread postby AirlinePilot » Mon 13 Nov 2006, 21:54:46

Oh, Im not accusing you of doing anything Gazzatrone. No problems at all with the data, Im just trying to get my head around how we could use more than we produce? Just doesn't make any sense to me. I had no attention of questioning the validity.

Sorry if you took it that way.
User avatar
AirlinePilot
Moderator
Moderator
 
Posts: 4378
Joined: Tue 05 Apr 2005, 03:00:00
Location: South of Atlanta

Re: Production vs. consumption chart, with world events

Unread postby Gazzatrone » Tue 14 Nov 2006, 01:01:13

$this->bbcode_second_pass_quote('AirlinePilot', 'O')h, Im not accusing you of doing anything Gazzatrone. No problems at all with the data, Im just trying to get my head around how we could use more than we produce? Just doesn't make any sense to me. I had no attention of questioning the validity.

Sorry if you took it that way.


YOu're OK Airline, No offence taken. I can understand the perplexity in the data. it didn't really dawn on me either. I think its because we are so use to the lines being flipped. Although I will say that if you look at the lines coming in from the 70's it would appear that the production ran higher than consumption as the lead in lines would suggest.
THE FUTURE IS HISTORY!
User avatar
Gazzatrone
Tar Sands
Tar Sands
 
Posts: 581
Joined: Mon 07 Nov 2005, 04:00:00
Location: London, UK
Top


Return to Peak oil studies, reports & models

Who is online

Users browsing this forum: No registered users and 1 guest

cron