To follow up on nth's post in the current events thread:
and also the post this morning on the discussion thread:
Sprott
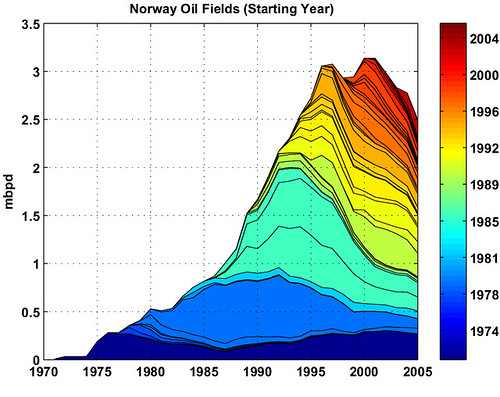
Here is a curve for Norway.
The first curve is the BP curve plus an assumed 400,000 barrel per day per year downward slope per this article (this is a 15% decline rate, and would be unprecedented).
The second curve is the Duncan and Youngquist prediction from 1997-2008 as predicted in 1997. In this case, the prediction was optimistic. Actual production never did reach 3.5 mbd.
$this->bbcode_second_pass_code('', '1971 6
1972 33
1973 32
1974 35
1975 189
1976 279
1977 287
1978 356
1979 407
1980 528
1981 512
1982 532
1983 661
1984 752
1985 823
1986 907
1987 1054
1988 1196
1989 1567
1990 1716
1991 1955
1992 2217
1993 2377
1994 2693
1995 2903
1996 3232
1997 3280 3369.863014
1998 3138 3413.69863
1999 3139 3452.054795
2000 3346 3471.232877
2001 3418 3452.054795
2002 3333 3452.054795
2003 3264 3432.876712
2004 3188 3410.958904
2005 2709.8 3390.410959
2006 2303.33 3375.342466
2007 1957.8305 3336.986301
2008 1664.155925 3298.630137')


PeakOil is You
Norway
![]() by pup55 » Wed 29 Jun 2005, 08:11:52
by pup55 » Wed 29 Jun 2005, 08:11:52
Thanks to Ayoob who provided the link
$this->bbcode_second_pass_quote('', 'N')orway (the other major North Sea oil producer) in the first four months of the
year saw its oil production similarly fall 10% compared to last year. Even more disturbingly, the month
of May alone saw a drop of 40,000 barrels per day versus April. If such a month-over-month rate of
decline continues then Norway will lose at least 400,000 barrels per day of production this year alone.
Sprott, thanks to Ayoob who provided the link
-

pup55 - Light Sweet Crude

- Posts: 5249
- Joined: Wed 26 May 2004, 03:00:00
![]() by RedViking » Sun 30 Oct 2005, 18:59:28
by RedViking » Sun 30 Oct 2005, 18:59:28
$this->bbcode_second_pass_quote('pup55', 'I')f such a month-over-month rate of
decline continues then Norway will lose at least 400,000 barrels per day of production this year alone.
decline continues then Norway will lose at least 400,000 barrels per day of production this year alone.
Data from the Norwegian Petroleum Directorates report .The Petroleum Resources on the Norwegian Continental Shelf 2005 surely states that the oil production in Norway is not expected to decline with 400,000 bbls a day in the future. Forecasted production from 2006 to 2009 is; 2,8 / 2,7 / 2,5 and 2,3. These figures are crude oil and exclude condensate and NGLs
-

RedViking - Wood

- Posts: 5
- Joined: Sun 30 Oct 2005, 03:00:00
- Location: Norway
Re: Norway
![]() by pup55 » Mon 31 Oct 2005, 09:25:21
by pup55 » Mon 31 Oct 2005, 09:25:21
[img][img]http://img334.imageshack.us/img334/2590/norwayprodforecast3mf.th.jpg[/img][/IMG]
Here's your graph.
The sprott estimate, the NPD estimate, and the Duncan and Youngquist 1997 prediction. It's still a pretty steep drop, I think.
Here's your graph.
The sprott estimate, the NPD estimate, and the Duncan and Youngquist 1997 prediction. It's still a pretty steep drop, I think.
-
pup55 - Light Sweet Crude
- Posts: 5249
- Joined: Wed 26 May 2004, 03:00:00
Re: Norway
![]() by pup55 » Sun 01 Jan 2006, 08:29:54
by pup55 » Sun 01 Jan 2006, 08:29:54
http://peakoil.com/fortopic16045.html
To update this thread with the post from Torjus:
The new estimate is actually more pessimistic than the estimate last year by Sprott.
To update this thread with the post from Torjus:
The new estimate is actually more pessimistic than the estimate last year by Sprott.
-
pup55 - Light Sweet Crude
- Posts: 5249
- Joined: Wed 26 May 2004, 03:00:00
Re: Norway
![]() by Raminagrobis » Mon 02 Jan 2006, 18:32:30
by Raminagrobis » Mon 02 Jan 2006, 18:32:30
$this->bbcode_second_pass_quote('pup55', 'T')o follow up on nth's post in the current events thread:
and also the post this morning on the discussion thread:
Sprott
Here is a curve for Norway.
and also the post this morning on the discussion thread:
Sprott
Here is a curve for Norway.
good post.
I used BP's figures (from BP statistical review of world energy 2005, i add the 2005 production figure you gave) to plot decline curves for norway.
Unfortunately, these production figures are "total liquids", it would be more accurate to separate NGL's from crude.
If someone want the excel (openoffice in fact, but i can convert it to excel) file that generates these curves, just ask for me to mail it.
The annual versus cumulative curve for norway is not very helpful, because decline has only started a few years ago. No clear trend appear.
But Deffeye's curve is better. deffeye's curve uses cumulative oproduction as "X" axis, and the "Y" axis is the ratio between annual and cumulativ production.
Deffeye's curve for norway show a near linear trend. It points very well to an ultimate of 30 Gb.
This figure would leave only 9.5 GB left to produce.
The latest reported reserve figure (january 2005) is 8.5 Gb. That's really close! It's exceptionnal than these two totally different ways of evaluating future production from a country (reserves, based on reservoir appraisal, and deffeyes's curve, based on production history) give figures that are only 10% apart.
The difference could well correspond to undiscovered fields. The 8.5 Figure was a year ago, somme 900 Mb have been produced since there... But some of the reserves have been replaced.
These predictions tend to ignore new provinces, but the only big remaining exploration scene is Barent's sea. Some 65 wildcats have been drilled so. Lots of gas were found (snovhit!) but only one well, a few weeks ago, encountered a small (#50Mb) oil field.
This is norway's creaming curve for discoveries :
http://www.mnforsustain.org/images/oil_ ... _fig18.jpg
(jean laherrere).
Its gives 3 Gb of ultimate oil+NGL in yet-to-find fields.
So I think we can sum up the datas for liquids (crude and NGL's) in norway as follow.The good quality of published datas, the maturity of exploration, and the confirmation by deffeye's plot make these figure quite accurate. There is of course a margin of error, but it's much smaller than for other countries.
(1) Roughly 29 Gb (billion barrels) of oil and NGL's in known fields, recoverable with today's thecnology. Of it :
20.5 have been produced.
4.5 Gb Remaning reserves in developped fields
4 Gb of reserves in undevelopped fields.
( = 8.5 Gb of reserves)
(2) perharps 2 or 3 Gb in yet-to-find fields.
(3) some potential for reserve growth, especially enhanced oil recovery, especially CO2 injection in large old fields like Gullfaks :
http://www.co2.no/default.asp?UID=62&CID=56
Tentatively estimated as 3 Gb (10% reserve growth, in fact more than that but only for suitable fields). Hoewever, the feasability of CO2-EOR in the Norwegian shelf have been challenged by a recent study.
TOTAL ULTIMATE PRODUCTION :
PAST : 20.5 Gb
FUTURE : 8.5 GB at least, 16 Gb at most.
In event event, there are now eating the 3rd quarter of the cake.

-
Raminagrobis - Wood
- Posts: 25
- Joined: Mon 18 Jul 2005, 03:00:00
Re: Norway
![]() by pup55 » Tue 03 Jan 2006, 14:34:41
by pup55 » Tue 03 Jan 2006, 14:34:41
Thanks for the post.
As you point out, Norway probably represents the best case scenario in terms of data transparency, and ability to determine reserves estimates.
This being the case, it should be an interesting test case for reserves growth due to technology advances. Also, a test case for how long a depleted field will remain viable after decline.
At a rate of 2.6 mbd/.95 gby the next 5 years will be interesting, at the current rate.
-
pup55 - Light Sweet Crude
- Posts: 5249
- Joined: Wed 26 May 2004, 03:00:00
Re: Norway
![]() by khebab » Tue 03 Jan 2006, 16:44:41
by khebab » Tue 03 Jan 2006, 16:44:41
Here is the result of the Hubbert Linearization method:


It looks like a perfect textbook case for the Hubbert method!
It looks like a perfect textbook case for the Hubbert method!
______________________________________
http://GraphOilogy.blogspot.com
http://GraphOilogy.blogspot.com
- khebab
- Tar Sands

- Posts: 899
- Joined: Mon 27 Sep 2004, 03:00:00
- Location: Canada
Re: Norway
![]() by TorrKing » Tue 03 Jan 2006, 16:53:16
by TorrKing » Tue 03 Jan 2006, 16:53:16
khebab
If you are right our production will be nearly halved in 2010! I am growing even more doomerish as we speak.
Torjus Gaaren
If you are right our production will be nearly halved in 2010! I am growing even more doomerish as we speak.
Torjus Gaaren
-
TorrKing - Tar Sands
- Posts: 717
- Joined: Thu 24 Nov 2005, 04:00:00
- Location: The ever shrinking wilds of Norway
Re: Norway
![]() by backstop » Tue 03 Jan 2006, 16:56:19
by backstop » Tue 03 Jan 2006, 16:56:19
$this->bbcode_second_pass_quote('Raminagrobis', '
')
TOTAL ULTIMATE PRODUCTION :
PAST : 20.5 Gb
FUTURE : 8.5 GB at least, 16 Gb at most.
In event event, there are now eating the 3rd quarter of the cake.
')
TOTAL ULTIMATE PRODUCTION :
PAST : 20.5 Gb
FUTURE : 8.5 GB at least, 16 Gb at most.
In event event, there are now eating the 3rd quarter of the cake.
I guess the above was meant to read
"In any event, they are now eating the 3rd quarter of the cake . . . ."
but in fact the numbers imply that only at best are they eating the cake's 3rd quarter, while at worst they're finishing off the cake's 3rd third.
The difference in depletion rates, and in the date at which home-drilled oil becomes unaffordable for economically critical uses, seems stark.
regards,
Backstop
"The best of conservation . . . is written not with a pen but with an axe."
(from "A Sand County Almanac" by Aldo Leopold, 1948.
(from "A Sand County Almanac" by Aldo Leopold, 1948.
- backstop
- Heavy Crude

- Posts: 1463
- Joined: Tue 24 Aug 2004, 03:00:00
- Location: Varies


![[img]http://img334.imageshack.us/img334/2590/norwayprodforecast3mf.th.jpg[/img]](http://img334.imageshack.us/my.php?image=norwayprodforecast3mf.jpg)