Motivation:
There is a lot of debate about why a sum of individual oil field productions should produce a symmetric curve. Intuitively, we feel that there is some degree of connection with the Central Limit Theorem:
$this->bbcode_second_pass_quote('', 'a')ny sum of many independent identically distributed random variables will tend to be distributed according to a particular "attractor distribution". The most important and famous result is called simply The Central Limit Theorem which states that if the sum of the variables has a finite variance, then it will be approximately normally distributed


PeakOil is You
Convergence of the sum of many oil field productions
23 posts
• Page 1 of 2 • 1, 2
Convergence of the sum of many oil field productions
![]() by khebab » Thu 12 Jan 2006, 02:01:33
by khebab » Thu 12 Jan 2006, 02:01:33
However, individual oil field productions are not random variables and are rather deterministic therefore the Central Limit Theorem cannot be invoked directly. The objectives are the following:
- 1- look at the conditions required to converge toward a particular "attractor distribution"
2- test the validity of the logisitic and gaussian distributions
Methodology:
I made the following assumptions:
- - production profiles of individual fields follow a triangular distribution function
- the URR, the left side slope (angle beta) , the right side slope (angle gamma) and the time of production start are random variables
[align=center]

[/align]
I use basic properties of triangles to derive a, b and c from beta, gamma and the URR: The law of sines and cosines:
[align=center]

 [/align]
By manipulating this two equations we get:
$this->bbcode_second_pass_code('', 'K1= sin(beta)/sin(gamma)
K2= 2*URR/sin(beta)
A=1-K1^2
B= 2*K1*K2*cos(gamma)
C= -K2^2
Delta= B^2 - 4.0*A*C
c= sqrt((-B+sqrt(Delta))/(2*A))
a= K2 / c
b= c * K1')
Consequently, the oil field production profile is the following:
$this->bbcode_second_pass_code('', 'f(x|alpha,beta,t,URR)= (x-t)/(a*c*cos(beta)), if x >= t and x <= t + c*cos(beta)
f(x|alpha,beta,t,URR)= (t + a - x)/(a*(a-c*cos(beta))), if x > t + c*cos(beta) and x <= t + a')
For now, I assume uniform distributions for the different random variables:
- - alpha and beta are distributed within an angle domain such as the resulting slopes are between 2% and 15%,
- the URR is uniformly distributed between 5 and 20,
- the starting year t between 1 and 21
Erratum: for the subplot at the bottom left corner of each figure, the y axis label should be "Prod. / Cum. Prod." instead of "Prod."
[align=center]
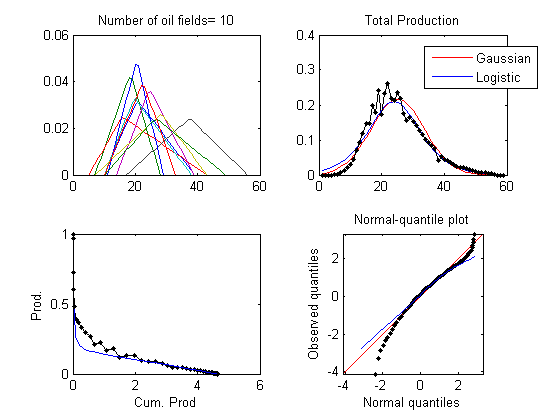
Result with 10 oil fields
[/align]
[align=center]

Result with 100 oil fields
[/align]
[align=center]

Result with 1,000 oil fields[/align]
[align=center]

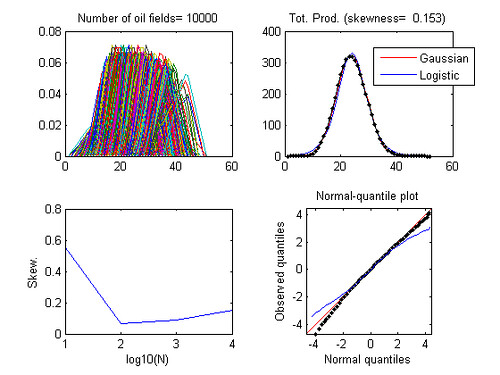
Result with 10,000 oil fields[/align]
Discussion:
- 1- the total production seems not to converge completely toward a gaussian or a logistic distribution in particular on the tails. However, these two models seem valid
2- the resulting curve is slightly asymmetric (skewness= 0.43) and a gamma function is maybe more appropriate
3- this is a simple model and there are many improvements possible in particular on the probability distribution function of the different variables
Edit (01/12/2006): corrections of a few english mistakes! sorry about that, english is not my first language (especially late at night).
Last edited by khebab on Tue 05 Aug 2008, 14:32:05, edited 3 times in total.
______________________________________
http://GraphOilogy.blogspot.com
http://GraphOilogy.blogspot.com
- khebab
- Tar Sands

- Posts: 899
- Joined: Mon 27 Sep 2004, 03:00:00
- Location: Canada
Re: Convergence of the sum of many oil field productions
![]() by EnergySpin » Thu 12 Jan 2006, 08:58:24
by EnergySpin » Thu 12 Jan 2006, 08:58:24
I think that a physically more plausible model for the production of each well, is that it follows a bi-exponential model
f(t) = A1 Exp[-k1 t]+A2 Exp[-k2 t] i.e. a two comparmental model.
This arises as a solution of the following system:
V1--->V2--->f(t)
Where URR = V1(0), V2(0) = 0, and the following differential laws are assumed:
V1'[t]=-k1 V1[t],
V2'[t]=-k2 V2[t]+K1 V1[t]
and f[t]=k2 V2[t].
Solving the system of differential equations leads to:
V1[t] =V1(0) Exp[-k1 t]
V2[t] = (k1*V1(0)) * (Exp[-k1 t] - Exp[-k2 t])/(k2-k1)
and f[t] = (k2*k1*V1(0)) * (Exp[-k1 t] - Exp[-k2 t])/(k2-k1)
The rationale for this model is simple:
The reservoir has a large volume of oil (V1 or URR) which is not directly accessible. Instead one drains a smaller potential compartment (V2) which is fed by V1.
Is it possible to run the simulation assuming this model?
"Nuclear power has long been to the Left what embryonic-stem-cell research is to the Right--irredeemably wrong and a signifier of moral weakness."Esquire Magazine,12/05
The genetic code is commaless and so are my posts.
The genetic code is commaless and so are my posts.
-

EnergySpin - Intermediate Crude

- Posts: 2248
- Joined: Sat 25 Jun 2005, 03:00:00
Re: Convergence of the sum of many oil field productions
![]() by khebab » Thu 12 Jan 2006, 09:03:31
by khebab » Thu 12 Jan 2006, 09:03:31
EnergySpin, thanks for the good comment!
$this->bbcode_second_pass_quote('EnergySpin', 'I')s it possible to run the simulation assuming this model?
$this->bbcode_second_pass_quote('EnergySpin', 'I')s it possible to run the simulation assuming this model?
Yes, I can. I will also post the code in R language later. I chose a triangular distribution because it's the simplest unimodal distribution that you can think of and is a good approximation of the envelope of a real oil field production curve. The objective here is that we are trying to find and equivalent of the Central Limit Theorem for the summation of arbitrary curves.
______________________________________
http://GraphOilogy.blogspot.com
http://GraphOilogy.blogspot.com
- khebab
- Tar Sands
- Posts: 899
- Joined: Mon 27 Sep 2004, 03:00:00
- Location: Canada
Re: Convergence of the sum of many oil field productions
![]() by WebHubbleTelescope » Thu 12 Jan 2006, 09:09:59
by WebHubbleTelescope » Thu 12 Jan 2006, 09:09:59
$this->bbcode_second_pass_quote('khebab', '
')2- the resulting curve is slightly assymetric (skewness= 0.43) and a gamma function is maybe more appropriate
')2- the resulting curve is slightly assymetric (skewness= 0.43) and a gamma function is maybe more appropriate
The gamma function occurs when I use the oil shock model and set all 4 rates to the same value and give it a delta function stimulus or another exponential function as input. In the former you get a 4th order gamma and the latter a 5th order gamma. I know this because it is a great way to check the numerical integration accuracy for my model:
http://mobjectivist.blogspot.com/2005/1 ... ution.html
Khebab, what you have discovered is the sampling version of doing convolution. I thought you did radar stuff, DSP and that. You should really be doing a convolution. If you wanted, you could put it in the frequency domain and perform FFTs and just multiply the results and then do an inverse FFT.
With that, I believe you are on the right track.
Try convolving a 4th order gamma and a segment of a quadratic. It is indistigushable from a gaussian on the up-slope.
Give up the ghost on the logistic and gaussian, the match is only empirical and the truth lies in modelling the stochastic process, with real initial conditions and solving the differential equations. And a lot of this amounts to doing convolutions.
-

WebHubbleTelescope - Tar Sands
- Posts: 950
- Joined: Thu 08 Jul 2004, 03:00:00
Re: Convergence of the sum of many oil field productions
![]() by EnergySpin » Thu 12 Jan 2006, 09:19:05
by EnergySpin » Thu 12 Jan 2006, 09:19:05
$this->bbcode_second_pass_quote('WebHubbleTelescope', '
')The gamma function occurs when I use the oil shock model and set all 4 rates to the same value and give it a delta function stimulus or another exponential function as input. In the former you get a 4th order gamma and the latter a 5th order gamma. I know this because it is a great way to check the numerical integration accuracy for my model:
http://mobjectivist.blogspot.com/2005/1 ... ution.html
Khebab, what you have discovered is the sampling version of doing convolution. I thought you did radar stuff, DSP and that. You should really be doing a convolution. If you wanted, you could put it in the frequency domain and perform FFTs and just multiply the results and then do an inverse FFT.
With all due respect, a garden variety FFT analysis is not going to do much with this messy time series.
Why not apply Bayesian spectrum analysis directly (which will allow us to incorporate prior information)?
There is also a couple of rather interesting pieces of work in exponential signal analysis in (biological) time series analysis which might of some relevance to this. One of it involved regularized algorithms for the numerical inversion of Laplace Transforms, and the other one involved MCMC methods.
I could provide references if anyone is interested ... just PM me.
"Nuclear power has long been to the Left what embryonic-stem-cell research is to the Right--irredeemably wrong and a signifier of moral weakness."Esquire Magazine,12/05
The genetic code is commaless and so are my posts.
The genetic code is commaless and so are my posts.
-
EnergySpin - Intermediate Crude
- Posts: 2248
- Joined: Sat 25 Jun 2005, 03:00:00
 . Working in the frequency domain is mainly a computational improvement.


 my guess is that the application of EOR will affect the growth rate (angle beta) and the decline rate (angle gamma) probably by producing a longer growth period and then a steep fall (c>>b).


 [/align]
 [/align]