$this->bbcode_second_pass_quote('pstarr', 'W')hatever, you still have not answered my request for proof of the recent crude-oil price drop. I asked you:
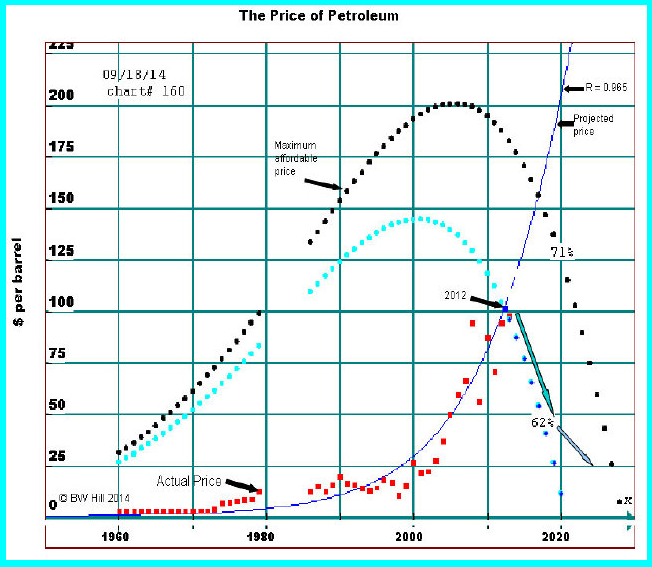
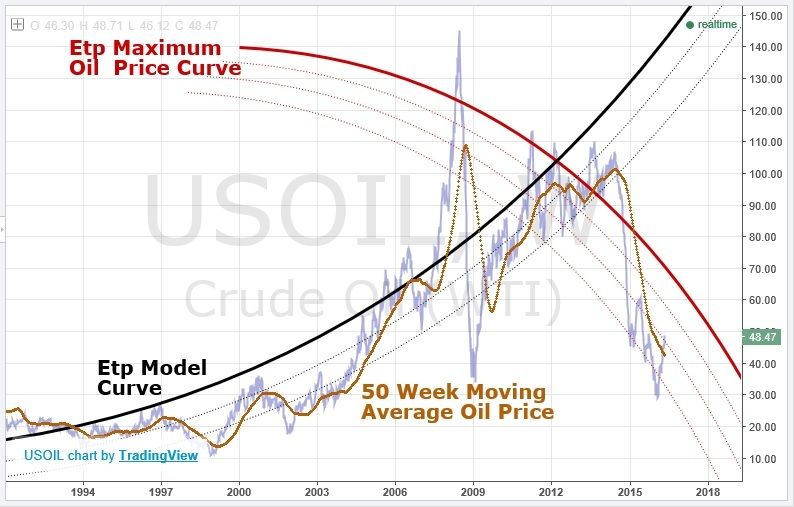
$this->bbcode_second_pass_quote('', 'W')ith due respect whatever: you claim the ETP model is predictive. Do you have proof? Can you point to where the model saw the recent precipitous oil-price drop beforehand? A link to an earlier chart, perhaps when oil was $100? Or $60 or something? A chart from the past with a line that drops like a dead cat about now. Is this the last oscillation?


PeakOil is You
Low oil price, high production equals peak oil? Pt. 3
Re: Low oil price, high production equals peak oil? Pt. 2
![]() by Whatever » Sat 11 Jun 2016, 15:34:10
by Whatever » Sat 11 Jun 2016, 15:34:10
That question was part of my query regarding water cut. I was honestly (rightfully given my admitted lack of physics) trying to understand how water cut is measured in lieu of reporting standards. Yes, Rockman dishonestly paraphrased me but you did not help by conflating my querie with his insult/dismissal
Dude. Look at the graphs I have been posting. The model has been predictive for two years.
Meanwhile, it feels like you are blocking for rockdoc. Uncool. Why are you doing that? And with red type like I just used? Seriously? You are trying to muddy the waters on purpose. No one could really be so tone deaf! I asked rockdoc a very important question that no one here will answer:
Is there a thermodynamic limit to the price of oil?
---Futilitist

Last edited by Whatever on Sat 11 Jun 2016, 15:44:21, edited 2 times in total.
-

Whatever - Permanently Banned
- Posts: 354
- Joined: Sun 22 Mar 2015, 21:19:05
Re: Low oil price, high production equals peak oil? Pt. 2
![]() by radon1 » Sat 11 Jun 2016, 15:36:31
by radon1 » Sat 11 Jun 2016, 15:36:31
$this->bbcode_second_pass_quote('Whatever', ' ')no one here will answer:
Is there a thermodynamic limit to the price of oil?
Is there a thermodynamic limit to the price of oil?
No.
- radon1
- Intermediate Crude

- Posts: 2054
- Joined: Thu 27 Jun 2013, 06:09:44
Re: Low oil price, high production equals peak oil? Pt. 2
![]() by ROCKMAN » Sat 11 Jun 2016, 15:48:10
by ROCKMAN » Sat 11 Jun 2016, 15:48:10
Radon - Of course there is: just look at the dramatic change in the thermodynamics of oil production that must have occurred about two years ago that brought about the crash in oil prices. Obviously the change was significant enough to drop oil to less then $30/bbl for a while. Who would have thought the thermodynamics could change that much so fast. LOL.
-

ROCKMAN - Expert

- Posts: 11397
- Joined: Tue 27 May 2008, 03:00:00
- Location: TEXAS
Re: Low oil price, high production equals peak oil? Pt. 2
![]() by Whatever » Sat 11 Jun 2016, 15:51:50
by Whatever » Sat 11 Jun 2016, 15:51:50
$this->bbcode_second_pass_quote('ROCKMAN', 'R')adon - Of course there is: just look at the dramatic change in the thermodynamics of oil production that must have occurred about two years ago that brought about the crash in oil prices. Obviously the change was significant enough to drop oil to less then $30/bbl for a while. Who would have thought the thermodynamics could change that much so fast. LOL.
You sure didn't.
LOL.
---Futilitist
-
Whatever - Permanently Banned
- Posts: 354
- Joined: Sun 22 Mar 2015, 21:19:05