

PeakOil is You
THE 2012 PO.com Oil Price Challenge
Re: THE 2012 PO.com Oil Price Challenge
![]() by obixman » Fri 02 Dec 2011, 10:09:57
by obixman » Fri 02 Dec 2011, 10:09:57
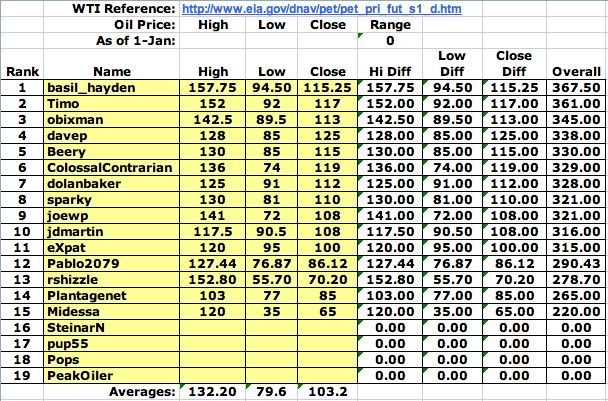
Don't forget mine --- 142.5 89.5 113
-

obixman - Prognosticator

- Posts: 96
- Joined: Sat 18 Jun 2005, 03:00:00
- Location: Houston, Texas
Re: THE 2012 PO.com Oil Price Challenge
![]() by joewp » Fri 02 Dec 2011, 12:41:19
by joewp » Fri 02 Dec 2011, 12:41:19
I think that because we're getting ever nearer to the eventual right hand side of Hubbert's curve, price volatility will begin to increase. But since there's obviously an oil price that crashes the economy, we will bounce off that again and again.
So:
High: $141
Low: $ 72
Close: $108
My aim is to be middle of the pack. Since I seem to achieve that ranking no matter what I aim for, so I might as well aim for mediocre and reach my goal!
So:
High: $141
Low: $ 72
Close: $108
My aim is to be middle of the pack. Since I seem to achieve that ranking no matter what I aim for, so I might as well aim for mediocre and reach my goal!
Joe P. joeparente.com
"Only when the last tree is cut; only when the last river is polluted; only when the last fish is caught; only then will they realize that you cannot eat money." - Cree Indian Proverb
"Only when the last tree is cut; only when the last river is polluted; only when the last fish is caught; only then will they realize that you cannot eat money." - Cree Indian Proverb
-

joewp - Intermediate Crude

- Posts: 2054
- Joined: Tue 05 Apr 2005, 03:00:00
- Location: Keeping dry in South Florida
Re: THE 2012 PO.com Oil Price Challenge
![]() by ColossalContrarian » Fri 02 Dec 2011, 14:14:02
by ColossalContrarian » Fri 02 Dec 2011, 14:14:02
My WAG...
High: $136
Low: $74
Close: $119
2012 will be my year to be in the top ten!!!
High: $136
Low: $74
Close: $119
2012 will be my year to be in the top ten!!!
- ColossalContrarian
- Heavy Crude

- Posts: 1374
- Joined: Tue 20 Jun 2006, 03:00:00
Re: THE 2012 PO.com Oil Price Challenge
![]() by pup55 » Tue 13 Dec 2011, 22:20:49
by pup55 » Tue 13 Dec 2011, 22:20:49
$this->bbcode_second_pass_quote('', 'C')itigroup forecast that Brent crude would trade in a range of $100 to $120 a barrel for the year, up from a previous forecast of $86/bbl, citing supply disruptions, low inventories and political tensions.
http://www.reuters.com/article/2011/12/ ... MI20111213
$this->bbcode_second_pass_quote('', 'C')rude stocks are currently much lower and much more bullish than we expected just three months ago," SocGen said in a note. "The key conclusion is that the very tight physical markets make $110 Brent a fairly valued starting point for our oil price outlook."
The bank upped its price forecast for European benchmark Brent by $10.00 to $110 a barrel and projected American Nymex crude would average $103 a barrel next year, up $23.00 from its previous expectations.
http://www.marketwatch.com/story/socgen ... 2011-11-22
$this->bbcode_second_pass_quote('', 'B')NP Paribas (Other OTC: BNPQF.PK - news) revised higher its forecast for U.S. crude oil prices by $3 to $104 a barrel, citing the possibility of strong demand in the northern hemisphere winter, and left its Brent crude forecast unchanged at $116 a barrel.
http://www.zimbio.com/Krzysztof+Roszyk/ ... e+forecast
$this->bbcode_second_pass_quote('', '
')LONDON: JP Morgan Chase & Co lowered its Brent and US crude price forecasts for 2012 on Wednesday and downgraded commodities to underweight partly due to the economic uncertainty in Europe and the United States and signs of a weaker growth in China.
The bank cut the West Texas Intermediate price forecast for next year to $107 per barrel from $110 and lowered its Brent outlook to $112 per barrel from $115.
http://articles.economictimes.indiatime ... t-forecast
-

pup55 - Light Sweet Crude

- Posts: 5249
- Joined: Wed 26 May 2004, 03:00:00


 I might as well join in the fun.