PeakOil is You
The 2011 PO.com Oil Price Challenge
Re: The 2011 PO.com Oil Price Challenge
![]() by basil_hayden » Fri 11 Nov 2011, 17:17:05
by basil_hayden » Fri 11 Nov 2011, 17:17:05
And Pops digs Spam.
-

basil_hayden - Heavy Crude

- Posts: 1581
- Joined: Mon 08 Aug 2005, 03:00:00
- Location: CT, USA
Re: The 2011 PO.com Oil Price Challenge
![]() by Pops » Fri 11 Nov 2011, 17:17:55
by Pops » Fri 11 Nov 2011, 17:17:55
I'm.. dreaming of a Spam... Christmas...
The legitimate object of government, is to do for a community of people, whatever they need to have done, but can not do, at all, or can not, so well do, for themselves -- in their separate, and individual capacities.
-- Abraham Lincoln, Fragment on Government (July 1, 1854)
-- Abraham Lincoln, Fragment on Government (July 1, 1854)
-

Pops - Elite

- Posts: 19746
- Joined: Sat 03 Apr 2004, 04:00:00
- Location: QuikSac for a 6-Pac
Re: The 2011 PO.com Oil Price Challenge
![]() by basil_hayden » Fri 11 Nov 2011, 17:27:14
by basil_hayden » Fri 11 Nov 2011, 17:27:14
Just like the ones we're used to now....
Where the pork fat glistens
and economic reports keep missin'....
Where the pork fat glistens
and economic reports keep missin'....
-
basil_hayden - Heavy Crude
- Posts: 1581
- Joined: Mon 08 Aug 2005, 03:00:00
- Location: CT, USA
Re: The 2011 PO.com Oil Price Challenge
![]() by Pops » Sat 12 Nov 2011, 09:31:20
by Pops » Sat 12 Nov 2011, 09:31:20
Here comes a swan now...
$this->bbcode_second_pass_quote('', '&')quot;One of the implications of the potential delay [in the Keystone pipe] would be to accelerate other pipeline solutions, including the potential Seaway solution," said Ed Morse, global head of commodities research at Citigroup.
"That could mean instead of waiting until 2013 for an evacuation of crude out of Padd 2 (Midcontinent) into Padd 3 (Gulf Coast) it might happen in 2012 instead."
Enbridge announced this week it will likely proceed with Wrangler, an 800,000 bpd, $2 billion pipeline that would shift crude from the Cushing to the giant U.S. Gulf Coast refining hub after receiving strong shipper interest. Enterprise is also a partner in Wrangler, which could be in service by mid-2013.
Confidence that one of these pipelines will help alleviate the Midwest glut can also be seen further out in the oil futures curve. The premium of December 2013 Brent to December 2013 WTI, which topped $17 a barrel in September, has dropped more than $3 this week to $8.35 on Friday.
"There's a growing realization that despite (Federal) government actions, the economic imperative is to move more oil out of Cushing, and that has been taking place." said Mark Routt, analyst and engineer at KBC in Houston.
The legitimate object of government, is to do for a community of people, whatever they need to have done, but can not do, at all, or can not, so well do, for themselves -- in their separate, and individual capacities.
-- Abraham Lincoln, Fragment on Government (July 1, 1854)
-- Abraham Lincoln, Fragment on Government (July 1, 1854)
-
Pops - Elite
- Posts: 19746
- Joined: Sat 03 Apr 2004, 04:00:00
- Location: QuikSac for a 6-Pac
Re: The 2011 PO.com Oil Price Challenge
![]() by Pops » Wed 16 Nov 2011, 18:27:30
by Pops » Wed 16 Nov 2011, 18:27:30
$this->bbcode_second_pass_quote('Pops', 'D')epending on if/when Enterprise buys the Conoco Seaway line and reverses the flow to the GOM refineries prices could pop quite a bit.
So why aren't I making money at this?
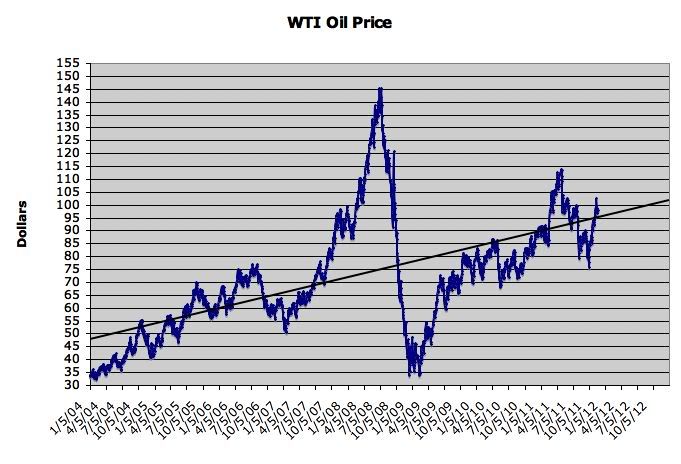
$this->bbcode_second_pass_quote('', 'T')he price of West Texas Intermediate crude oil, which has sold for as much as a 25% discount to Brent oil over the past 9 months, has been slowly filling that gap recently. And, with the announcement today that a major pipeline would further relieve the surplus of WTI at Cushing (taking it away to the Gulf Coast), the discount has closed further.
As of this morning, WTI soared to $102.00 as Brent has fallen closer to $110.00. Accordingly, the full impact of the higher global price of oil is now about to be visited upon North America. Is that bad news, or good news?
Read more: http://feedproxy.google.com/~r/Gregorus ... z1duSnPjjD
The legitimate object of government, is to do for a community of people, whatever they need to have done, but can not do, at all, or can not, so well do, for themselves -- in their separate, and individual capacities.
-- Abraham Lincoln, Fragment on Government (July 1, 1854)
-- Abraham Lincoln, Fragment on Government (July 1, 1854)
-
Pops - Elite
- Posts: 19746
- Joined: Sat 03 Apr 2004, 04:00:00
- Location: QuikSac for a 6-Pac
Re: The 2011 PO.com Oil Price Challenge
![]() by kublikhan » Wed 16 Nov 2011, 18:40:25
by kublikhan » Wed 16 Nov 2011, 18:40:25
$this->bbcode_second_pass_quote('Pops', 'S')o why aren't I making money at this?
Did you invest in the right stocks? Enterprise is sitting at a 52 week high.The oil barrel is half-full.
-

kublikhan - Master Prognosticator

- Posts: 5064
- Joined: Tue 06 Nov 2007, 04:00:00
- Location: Illinois