Peak Oil is You

Donate Bitcoins ;-) or Paypal :-)
Page added on February 29, 2020
USA December Oil Production Drops

A Post by Ovi at peakoilbarrel
All of the oil production data for the US states comes from the EIAʼs Petroleum Supply Monthly. At the end, an analysis of a three different EIA reports is provided.
The charts below are updated to December 2019 for the 10 largest US oil producing states (Production > 100 kb/d).

The data from the February EIA report shows that US production dropped from November by 84 kb/d (0.61 kb/d) to 12,779 kb/d in December. Since June, the US has increased output by an average of 164 kb/d/mth. Is this drop the beginnings of slowing LTO growth going into 2020? Today’s low oil prices are not providing any incentive to increase drilling activity. Maintaining current production and lowering expenses may be the new mantra.
For the lower 48 states, production decreased by 81 kb/d.
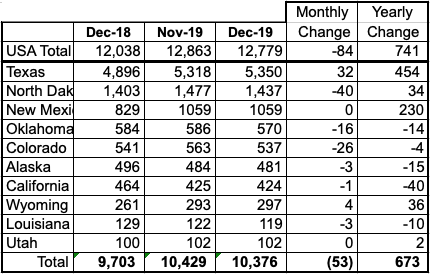
Listed above are the 10 states with production greater than 100 kb/d. These 10 account for 10,376 kb/d (81%) of total US production of 12,779 kb/d in December. US year over year production fell below 1000 kb/d to 741 kb/d. For last month, November, the year over year increase was 1,248 kb/d.
What is different in this table from previous ones is that all of the major states. except Texas, Wyoming and Utah had a decline in output. Of the total decline of 84 kb/d, these top states contributed a decline of 53 kb/d. The biggest decline occurring in North Dakota.
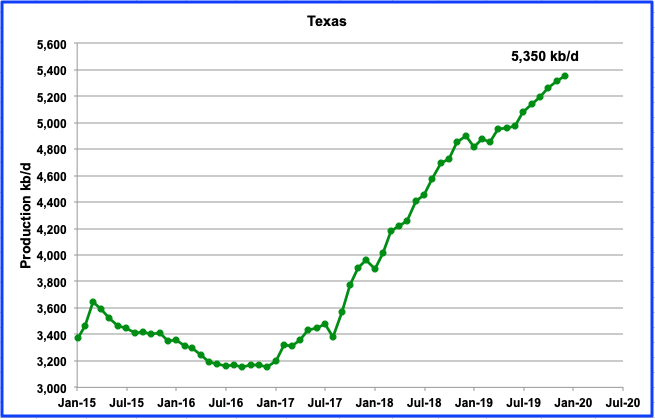
Texas December production grew by 32 kb/d to 5,350 kb/d from 5,318 kb/d in November. Note that November was revised down from 5,329 kb/d in the November report to 5,318 kb/d. Texas production is now larger than OPEC’s second largest producer, Iraq.
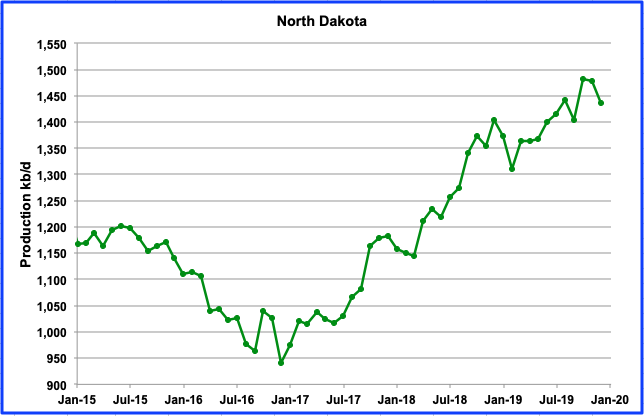
North Dakota’s oil production was down by 40 kb/d in December to 1,437 kb/d. Since August the number of rigs operating each month has almost remained constant as it wandered between 47 and 55 with 52 operating since late January and into February.
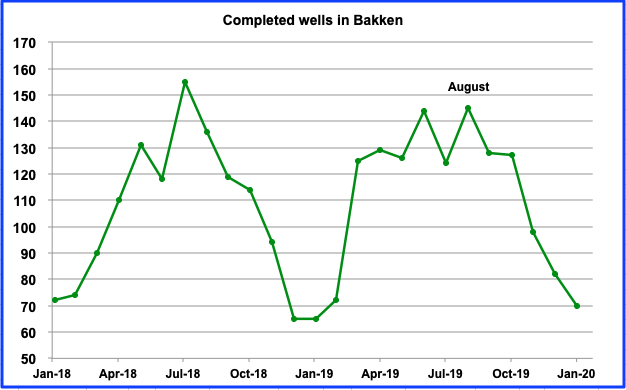
The number of completed wells in the Bakken started to drop in September 2019 and has continued to decline up to January. In January 70 were completed, whereas 145 were completed in August. Since August, with completions in decline, output has been essentially flat wandering around 1,440 kb/d up to November. However as noted above, there was drop in December of 40 kb/d. Will the drop continue as the number of completions continues to decline and the price of oil stays below $50?
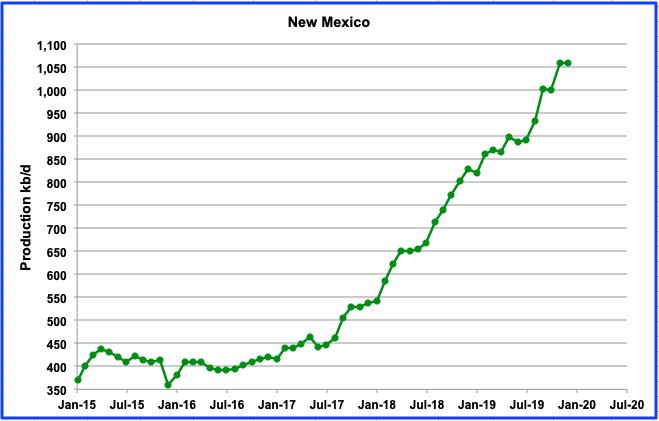
Output in New Mexico was flat from November to December and stayed above the 1000 kb/d level. November production was revised down from 1,063 kb/d to 1050 kb/d. While Texas has been getting much attention regarding its production growth, New Mexico has also increased its output and recently has exceeded 1 Mb/d. Since July, it has increased its overall output by 158 kb/d. On a YOY basis, New Mexico has increased its output by 230 kb/d.
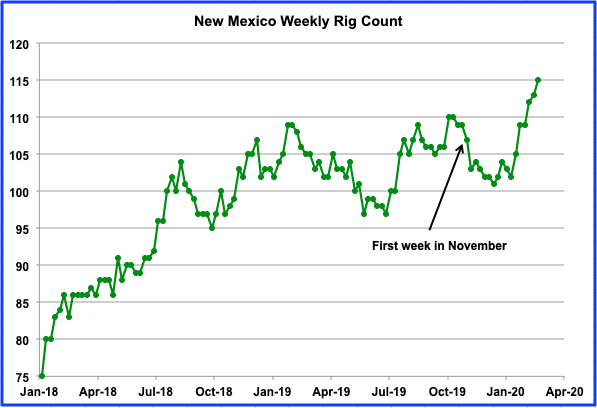
Above is the weekly rig count for New Mexico. While there were an average of 104 rigs operating in November and December 2019, by the third week in February 2020 (Feb 28), 115 were in operation. This is a good indicator of further growth coming from New Mexico.
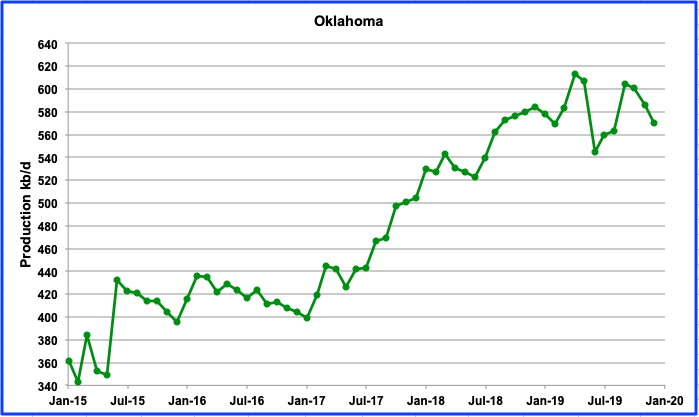
December marked the third month in a row that Oklahoma output was down. December production was down by 16 kb/d to 570 kb/d. Oklahoma appears to be entering a decline phase. The highest production occurred in April 2019 with production of 613 kb/d. As noted previously, there has been a loss of drilling interest in Oklahoma due to the complex geology that stymied hopes for a “Permian Jr”.
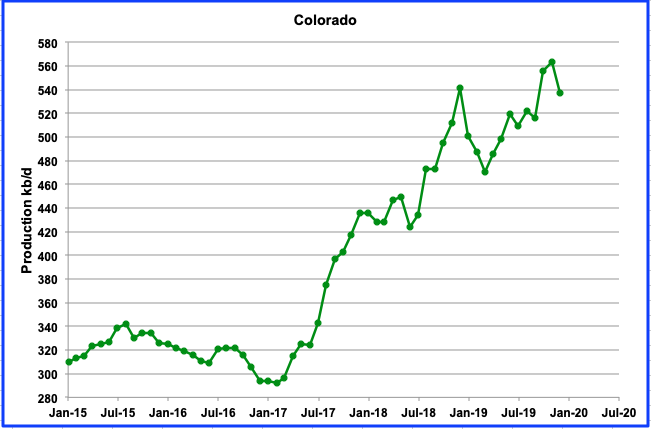
Colorado production declined by 26 kb/d in December to 537 kb/d from 563 kb/d in November. The small output rise in November, followed by the drop in December could be the first signs of the impact of new local environmental regulations. It may take a few more months to see if the regulations continue to slow drilling and output.
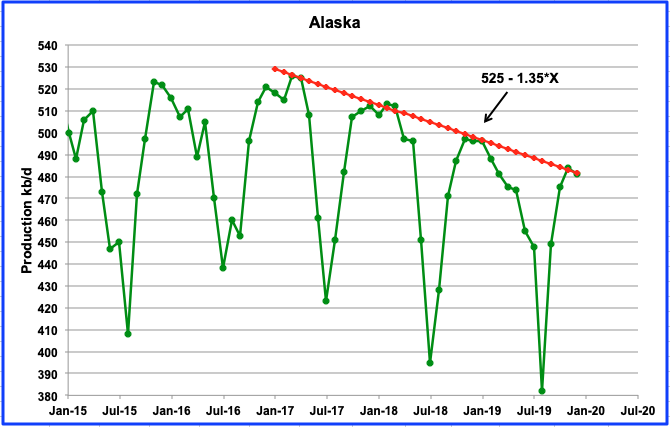
Alaska output decreased by 3 kb/d in December to 481 kb/d and touched the down trend line, which is showing decline rate of 1.35 kb/d/mth or 16.2 kb/d/yr.
“The trend of gradually declining output is expected to continue until several new projects now in development come on line. Fiord West, a satellite within the Alpine field, is expected to begin production in late 2020 with peak output estimated at 20,000 barrels per day, ConocoPhillips’ Lowman said. Frontiersman.
The 20 kb/d increment near the end of the year will mostly be offset by the estimated yearly decline of 16.2 kb/d.
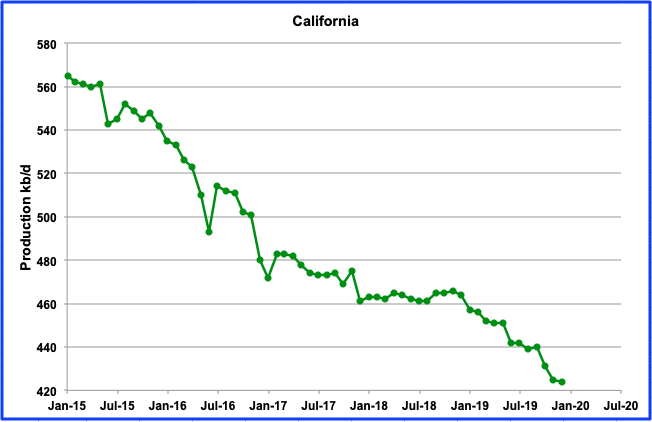
California continues its slow decline. December production was down by 1 kb/d to 424 kb/d.

Wyoming continues to increase its output and reached a new high of 297 kb/d in December with a minimal increase of 4 kb/d. It continues to benefit from the northern portion of the Niobrara LTO basin being situated in Wyoming. Wyoming currently has 23 rigs in operation, after adding 2 in the fourth week of February,
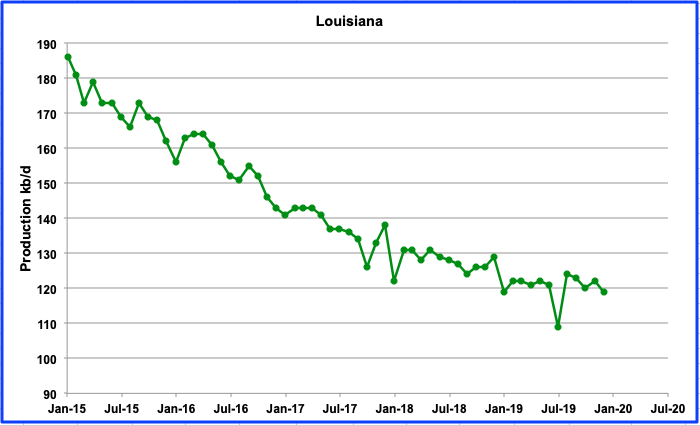
There was little change in Louisiana output for December, down by 3 kb/d to 119 kb/d. Production has been essentially flat bouncing around 120 kb/d since January 2019.
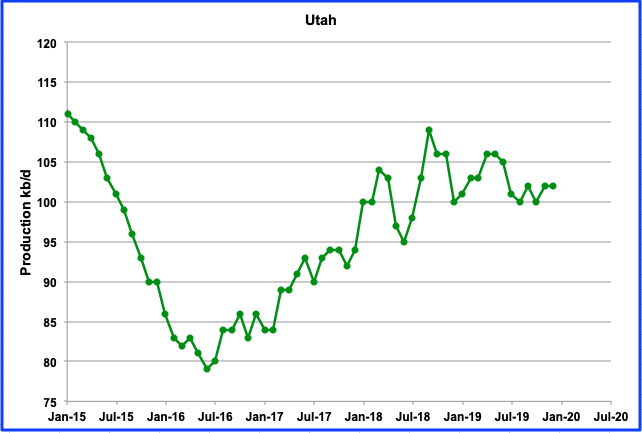
Utah’s output is holding steady at slightly over 100 kb/d due to its new conventional field but is giving indications of starting a new slow decline. December production was 102 kb/d and flat from November 2020.
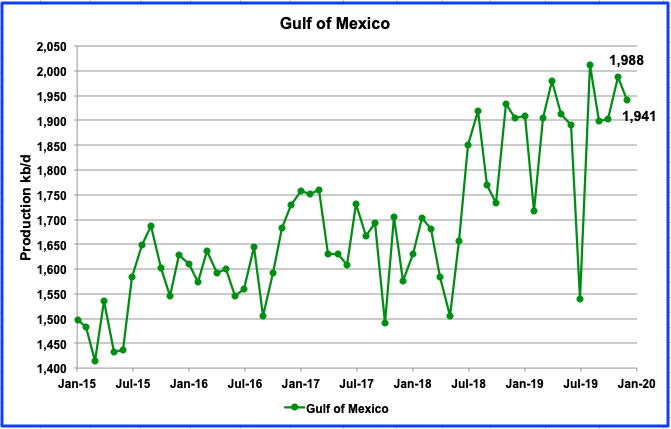
The GOM’s output dropped by 47 kb/d in December to 1,941 kb/d from 1,988 kb/d in November. The STEO is projecting January production to remain low at 1,930 kb/d.
Ducs
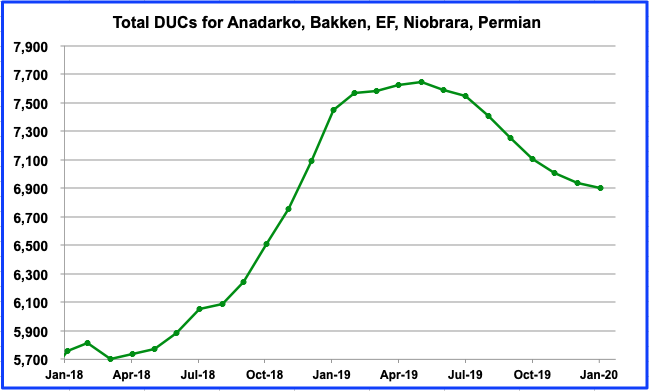
This chart shows the number of DUCs in the five primary oil producing basins. In January, the number of DUCs declined by 31 to 6,905. The biggest decline occurred in the Anadarko, 50. On the other hand, the Niobrara increased by 10 and the Permian by 14.
UPDATING EIA’S DIFFERENT OIL GROWTH PERSPECTIVES
1) DRILLING PRODUCTIVITY REPORT (DPR)
The Drilling Productivity Report (DPR) uses recent data on the total number of drilling rigs in operation along with estimates of drilling productivity and estimated changes in production from existing oil wells to provide estimated changes in oil production for the five key tight oil regions.
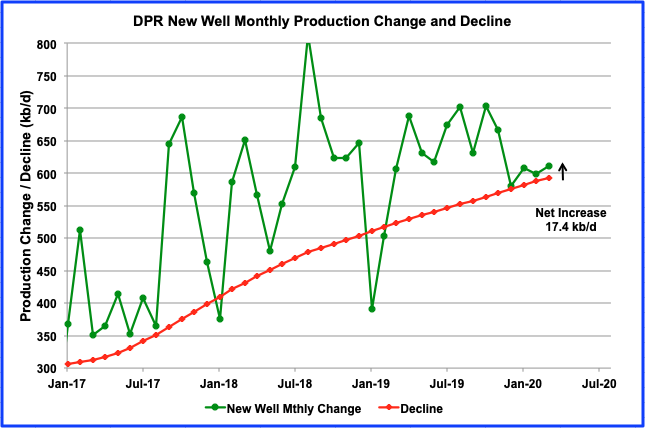
This chart shows the monthly change in new well oil production and the decline from all previous producing well for the onshore L48 states. The difference between the two gives the projected output increase for all tight oil basins. For March 2020, the projected increase is 17.4 kb/d.
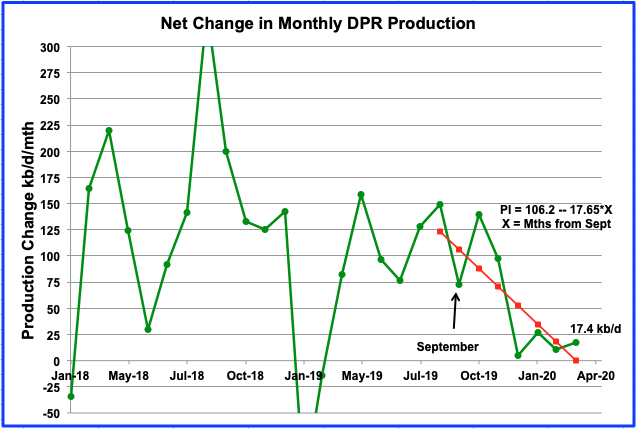
Above is the DPR net growth chart updated to March 2020 and is the difference between the monthly change in new well oil production and the decline from all previous producing well for the onshore L48 states. There has been quite a revision to the data for 2019. The March report now shows that December 2019 net growth fell to 5.3 kb/d. In the January report, it was 54.6 kb/d.
Going forward from December 2019, the DPR is projecting growth for the L48 LTO regions to bounced around 20 kb/d. These projected small increases of 20 kb/d/mth since December are consistent with the STEO forecast which is indicating a peak in the lower 48 states in May and a peak in the L48 minus GOM in October. There is very little growth projected from March to October. These current WTI prices below $50/bbl are not going to help.

The onshore L48 output fell by 36 kb/d in December. According to the DPR, output should have been similar to November with a small increase of 5 kb/d. The STEO is projected an increase of 50 kb/d over November and the MER is showing a decline of 16 kb/d. The LTO was projecting an increase of 31 kb/d. The MER is closest to the actual drop of 36 kb/d.
It should be noted that all of the projected increments are much less than the typical increase of 100 kb/d/mth. The takeaway message seems to be that production growth going forward may be slowing.
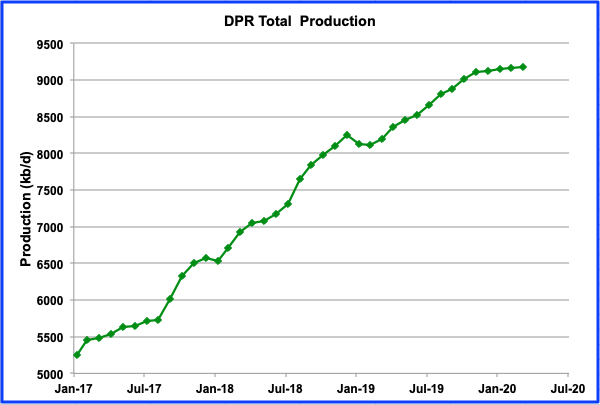
Above is the total oil production from the 7 basins that the DPR tracks. Note that the DPR production includes both LTO oil and oil from conventional wells.
From February 2019 to November 2019, output grew at an average rate of 111 kb/d/mth. However starting in December, output slowed to an average rate of 15 kb/d/mth, similar to the rate shown for March in the previous chart; “Net Change in Monthly DPR Production”. The reduced output rate is associated/consistent with the monthly decline in the number of well completions shown below.
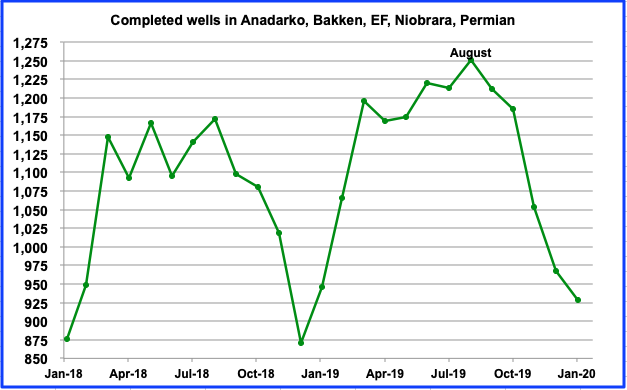
As can be seen, the number of completed wells from August 2019 to January 2020 dropped from 1,251 to 929 respectively, a drop of 322 wells.
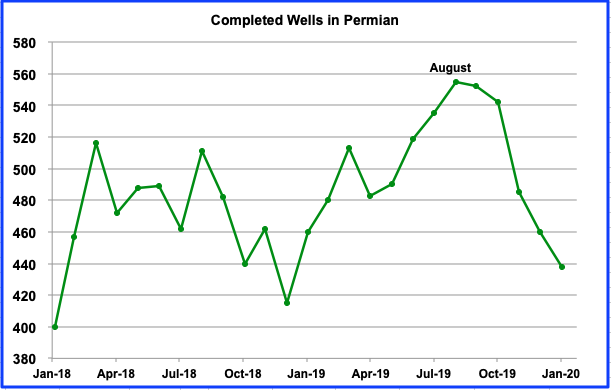
Of the 322 decrease in well completions since August, 117 are from the Permian. Interestingly, while completions are decreasing, Texas was only one of three states that showed a production increase in December of 32 kb/d.
2) LIGHT TIGHT OIL (LTO) REPORT
The LTO database provides information only on LTO production from seven tight oil basins and a few smaller ones.
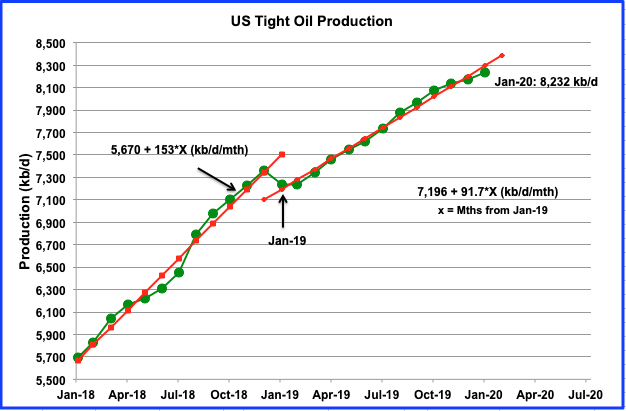
There was a significant downward revision to the LTO data in January 2020. The revisions shows up as a slowing in LTO monthly production growth, especially over the last three months, as can be seen in the chart.
Estimated output from all LTO basins in January was 8,232 kb/d, an increase of 61 kb/d from 8,171kb/d in December. However the previous December report stated that LTO December output was 8,252 kb/d. The January report has now revised the December output down to 8,171 kb/d, a reduction of 81 kb/d.
The average monthly increase from January 2019 to January 2020 is 91.7 kb/d/mth and is 40% lower than 2018. However, the average rate over the last three months has slowed to 51 kb/d/mth, a 44% reduction. It is also 1/3 of the 2018 rate of 153 kb/d/mth.
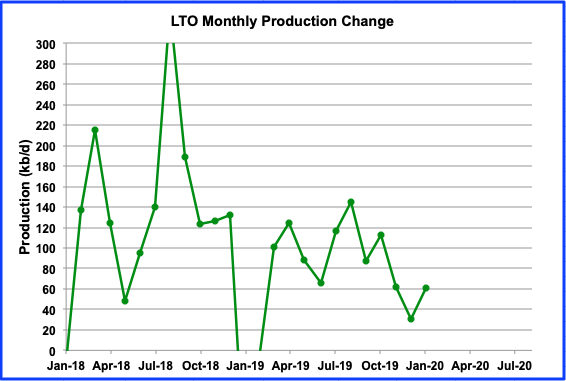
This chart shows the monthly addition to LTO output and is similar to the DPR chart above. The production increase in January was 61 kb/d and is an increase over December. The current January LTO report confirms the DPR trend of slowing growth starting in October to January 2020. However while the LTO report is projecting an increase of 61 kb/d in January 2020, the DPR is estimating a smaller growth rate of 27 kb/d.
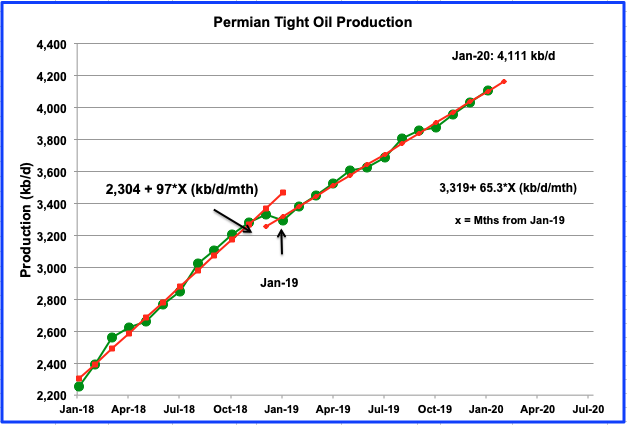
The Permian is the largest contributor to US tight oil growth. As can be seen in this chart, the average growth rate for 2019 is lower than 2018. While the average monthly growth rate for 2018 was 97 kb/d/mth, the average rate for 2019 is lower at 65.3 kb/d/mth. However in this case, averages are deceptive. The January report provides updated monthly data that indicates the average LTO growth rate from October 2019 to January 2020 increased to 79 kb/d/mth.
3) SHORT TERM ENERGY OUTLOOK (STEO) REPORT
The STEO provides projections for the next 13–24 months for C + C and NGPLs production. The February report presents EIA’s oil output projections out to December 2021.
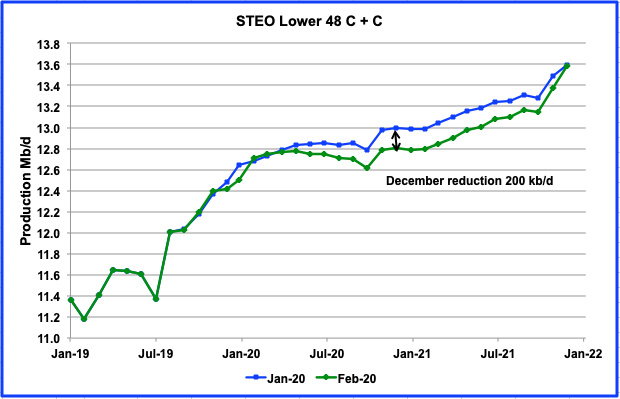
This chart compares the February 2020 STEO projection with January 2020 report. The estimated output for December 2020 has been reduced by 200 kb/d. As noted last month, the increase in production for 2020 in the January report was surprising since the STEO was slowly lowering it future output each month in the previous reports. What is interesting to note is that the output from May 2020 to December 2020 in the STEO February report is very close to the original December 2019 report, i.e., within +30 kb/d to -10 kb/d.
From December 2019 to December 2020, US production is estimated to increase by just 390 kb/d. For 2021, the STEO is projecting an increase of 780 kb/d, double the 2020 increase. Surprising?
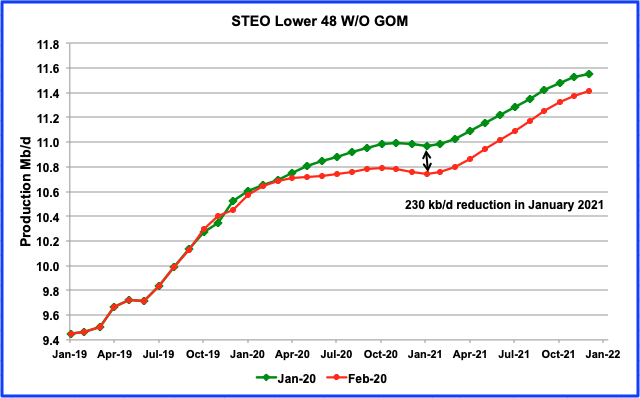
This chart provides a clearer picture of what the STEO is projecting for the Onshore L48 states and compares the December 2020 STEO projection with the February one. Similar to the previous chart, there has been a significant reduction across the board for onshore L48 oil output. The biggest revision occurs for January 2021 where the estimate has been reduced by 230 kb/d. For December 2021, the reduction is 140 kb/d.
The projected increase from December 2019 to December 2020 is 310 kb/d.
I was hoping to include an updated world oil production chart to November but the EIA did not release it today as it usually does at the end of the month.
One Comment on "USA December Oil Production Drops"
makati1 on Sun, 1st Mar 2020 2:16 am
Waste of time article. In other news:
“State-Sponsored Commercial Espionage. The Global Theft of Ideas”
https://www.globalresearch.ca/state-sponsored-commercial-espionage-the-global-theft-of-ideas/5698092
“After digesting its massive theft of ideas, things and people from Paperclip following the end of World War II, the US wasted no time in designing and implementing the world’s largest network of commercial espionage that has ever existed, and one which still exists in vastly expanded form today – as we saw from the revelations by Edward Snowden.”
Blaming China for the same things Amerika is doing…pure, arrogant hypocrqcy.