Peak Oil is You

Donate Bitcoins ;-) or Paypal :-)
Page added on July 4, 2012
US Crude Production by State

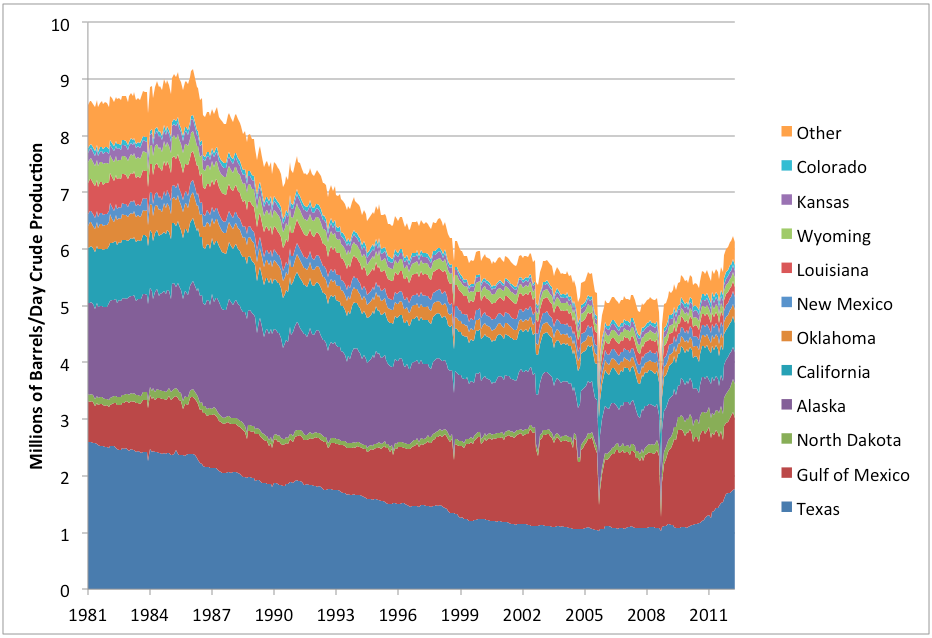
The above chart shows US crude oil production by month from Jan 1981 through April 2012. I have broken out all the states producing more than 100 kbd (thousand barrels/day) by the end. The original peak level of the total came in November 1970 at 10.044mbd, but the per-state data doesn’t go back that far on the EIA website. There was a secondary peak (mainly due to Alaska) in 1985/1986. Then there was a long decline until the last couple of years.
The resurgence of production in the US in recent years has given new hope to long-standing cornucopians. At a minimum, it’s certainly important in driving the spread between WTI and Brent oil prices. I remain uncertain at this time how far this trend can go – there’s little doubt that there’s a huge amount of oil in the ground in the Bakken rock formation, for example, but there remains huge uncertainty in how much will be eventually recoverable given the very poor properties of the rock and I, at least, am not yet clear on what the long-term sustainable economics of these projects looks like.
If we take the state data above and do invidual lines, we get this:

You can see that the upsurge in the last couple of years comes entirely from North Dakota (Bakken) after 2007 and then Texas even more abruptly since 2010 – Texas has added something like 600kbd in two years.
2 Comments on "US Crude Production by State"
BillT on Thu, 5th Jul 2012 1:55 am
Easy come, easy go. And the age of oil is going…fast.
SOS on Thu, 5th Jul 2012 1:00 pm
Politics will determine how much is recovered. Peak politics will result in peak oil. Orderly development will insure ample and affordable energy supplies. A blessing for everyone.