Update on coal

This a guest post by Jean Laherrère, retired geologist from TOTAL and key founding member of ASPO; in recent years he has been a prolific contributor to this website. In this post Jean updates his model of future world Coal extraction and puts it in perspective within his fossil fuel model.
In 2007 the world coal production was modeled with an ultimate of 600 Gtoe and the peak was forecast at 4.2 Gtoe around 2050.
Figure 1: world coal production and model for an ultimate of 600 Gtoe in 2007
Also in 2007 the Energy Watch Group (EWG – Zittel LBST) in its report “
Coal: resources and future production” was modelling world coal production with a peak around 2030 at 3.6 Gtoe, well below the IEA/WEO 2006 forecast which was at 4.5 Gtoe.
Figure 2: world coal production by the Energy Watch Group in 2007
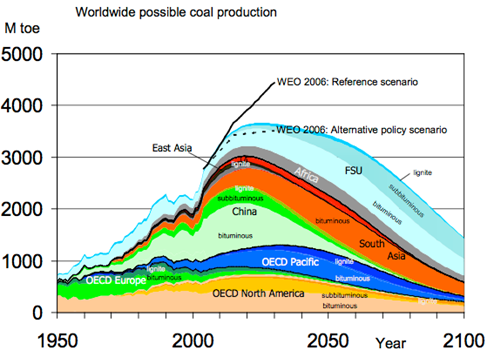
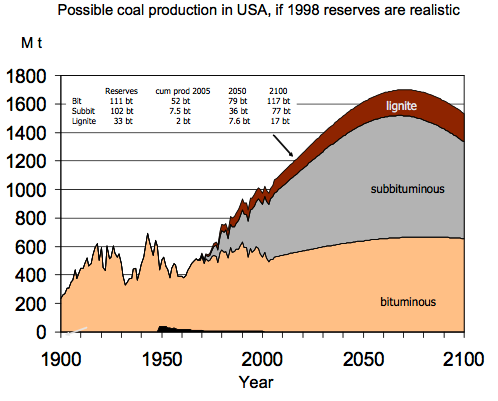
China was forecast peaking in the 2010s and close to exhaustion in 2070. The US coal production was forecast peaking in 2080.
Figure 3: US coal production by the Energy Watch Group in 2007
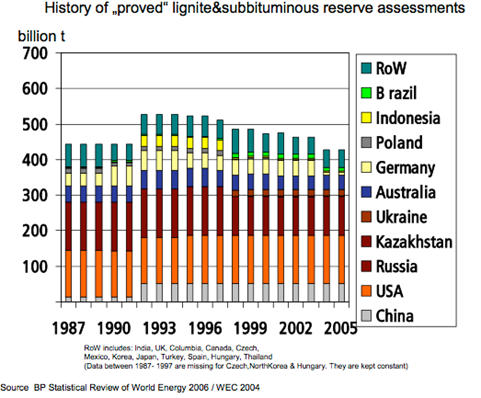
The EWG study was based on the BP 2006/WEC 2004 estimates of about 500 Gt for hard coal and around the same for lignite & sub-bituminous coal, for a total of 1000 Gt, or 500 Gtoe, meaning an ultimate of 650 Gtoe.
Figure 4: history of hard coal reserves by the EWG in 2007
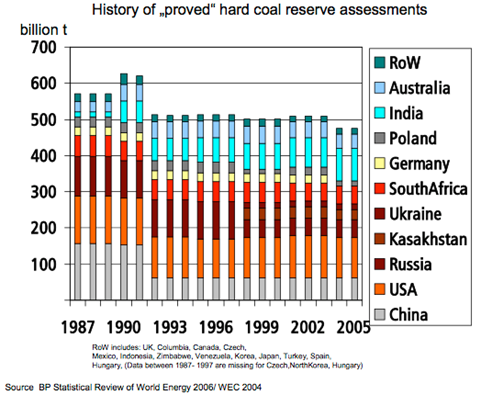 Figure 5: history of lignite & sub-bituminous reserves by the EWG in 2007
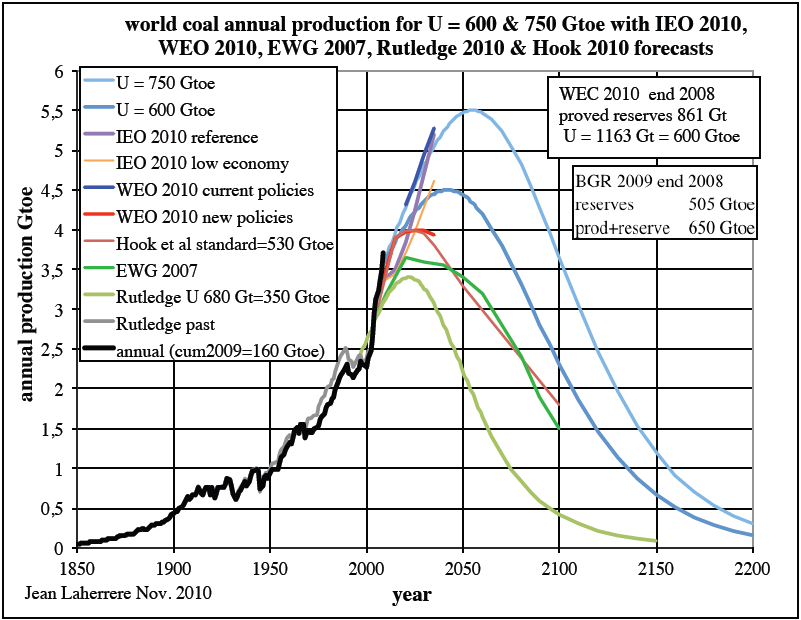
In 2010 I increased the ultimate for my model up to 750 Gtoe, to take care of the strong increase in production since 2000, mainly due to China. The peak was then still in 2050 but at 5.5 Gtoe. The cumulative production was 156 Gtoe at the time and the remaining reserves estimated at 505 Gtoe by the BGR, 405 Gtoe by WEC (copied by BP). The EWG was far below these estimates. The Uppsala group model (
Hook et al. 2010) was based on an ultimate of 530 Gtoe.
Figure 6: world coal production for U= 600 & 750 Gtoe with IEO 2011, WEO 2010, EWG 2007, Rutledge 2010 & Hook 2010 forecasts
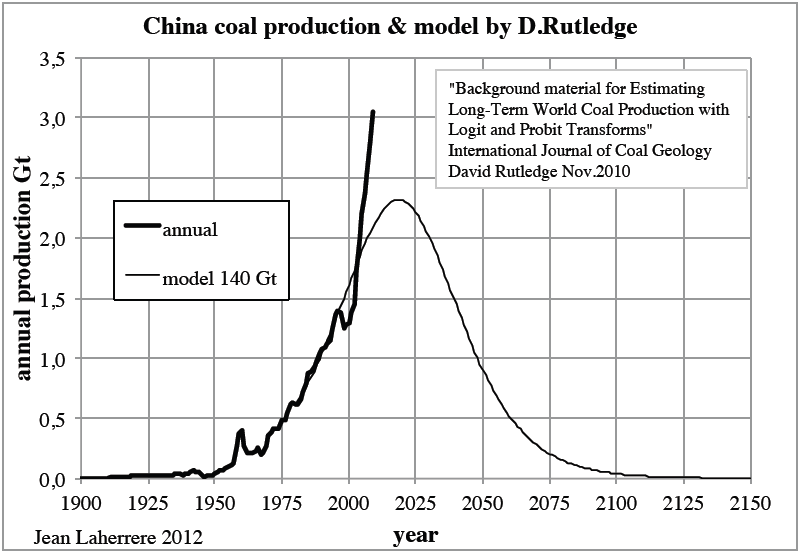
In 2010 David Rutledge (Caltech) published a report accompanied by a spreadsheet available with all the data available on the Internet: “
Background material for Estimating Long-Term World Coal Production with Logit and Probit Transforms” International Journal of Coal Geology. His model was for an ultimate of 675 Gt or about 350 Gtoe.
Figure 7: world coal production & model by Rutledge 2010

Rutledge models China with an ultimate of 140 Gt (about 70 Gtoe).
Figure 8: China coal production & model by Rutledge 2010
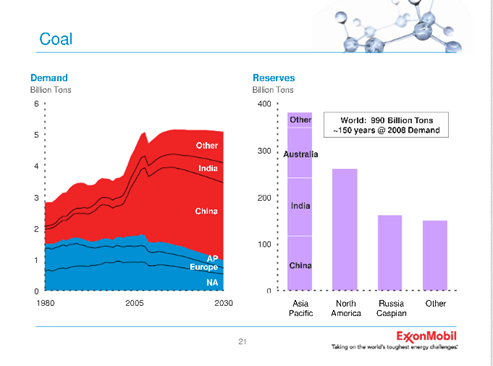
The forecast by Exxon-Mobil in their “
Outlook for energy” has varied with time for the last three years. At the US EIA and John Hopkins University 2010 Energy Conference, Tom Eizembe, from Exxon-Mobil’s Corporate Strategic Planning delivered a presentation entitled “
The Outlook for Energy a view to 2030” where the company’s cols reserves estimate was put at 990 Gt.
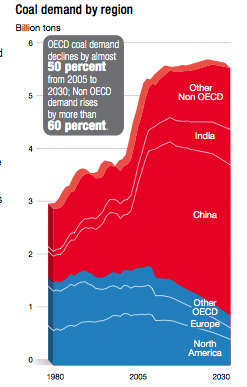
Figure 9: world coal production by Exxon-Mobil 2010
In 2011, the Exxon-Mobil forecast was flat from 2010 to 2030, but at a higher level of 5.5 Gt
Figure 10: world coal production by Exxon-Mobil 2011
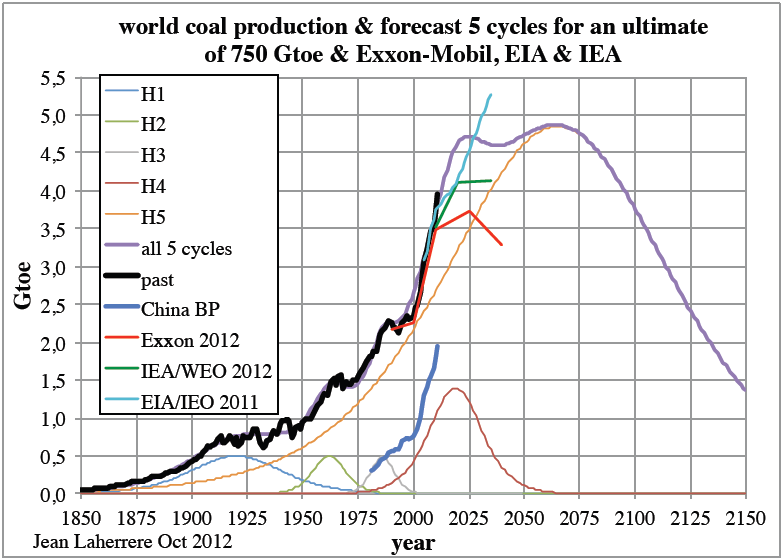
In 2012 Exxon-Mobil in its outlook to 2040 forecasts coal demand in 2040 to be less than in 2010, with a peak in 2025 at 3.7 Gtoe. This is significantly lower than my model at 4.6 Gtoe. The EIA/IEO 2012 is not yet published but the 2011 edition forecasts for 2035 a production of 5.3 Gtoe, higher than my plateau at 4.6 Gtoe.
My new update in 2012 on coal production is based on an ultimate of 750 Gtoe, modelled with 5 cycles and here compared to Exxon-Mobil 2012, IEA/WEO 2012 and EIA/IEO 2011. The forecasts by Exxon-Mobil and the IEA are already too low compared to the 2011 value, only the EIA seems in line with my forecast.
Figure 11: world coal production modeled with 5 cycles for an ultimate of 750 Gtoe with forecasts from Exxon-Mobil, IEA & EIA
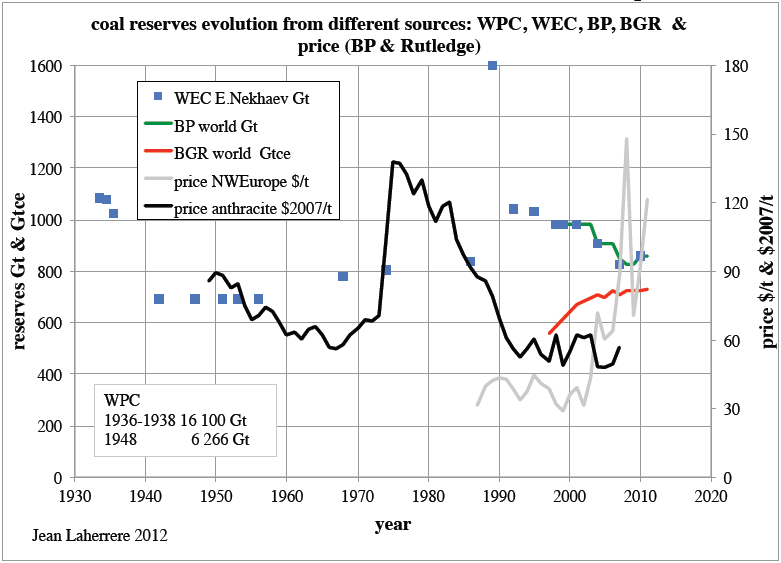
The remaining world coal reserves vary between sources (WEC, BP recopying WEC, BGR) and with time. Following the price is displayed and apparently it does not play any impact on reserves estimates.
Figure 12: world coal reserves evolution from different sources and coal price
The big problem is to distinguish between reserves, which are expected to be produced economically with the known technology and resources, in essence the volume without any constraints. Presently, coal seams less than 50 cm thick, deeper than 1500 m or offshore are not considered as reserves. This is why for the world the volume of resources is more than 20 times the volume of reserves. The constraints are mainly energetic: energy return over energy invested.
A big breakthrough could be “in situ gasification” (underground coal gasification = UCG), but many attempts in the last century (first patents in 1910) and in the new century were not successful. In 2007 the WEC estimated UGC potential at 600 Gt.
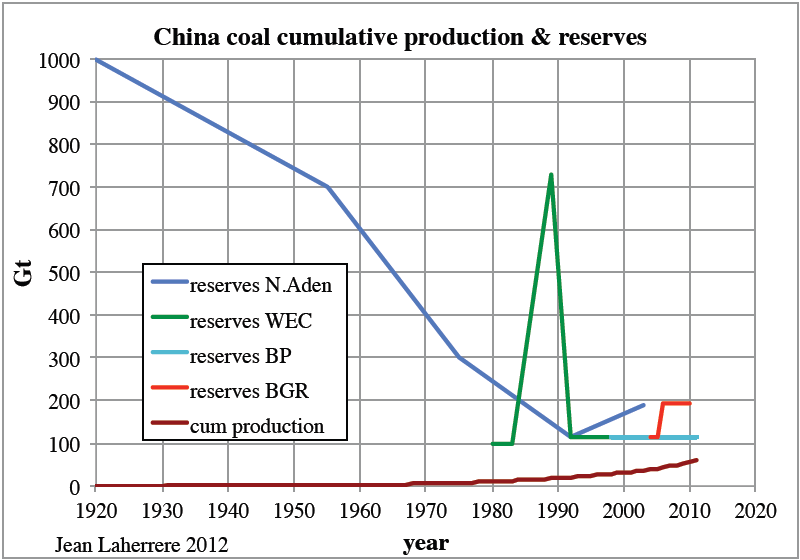
The spike in WEC estimates in 1989 is sometimes called the Chinese spike. It seems to be a mistake or is it a temporary change in definition?
Figure 13: China coal cumulative production and reserves evolution
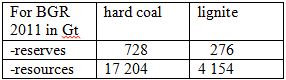
The BGR displayed an increase of China coal reserves and resources since 2004, broken down into hard coal and lignite (called before brown coal).
Figure 14: China coal reserves & resources from BGR
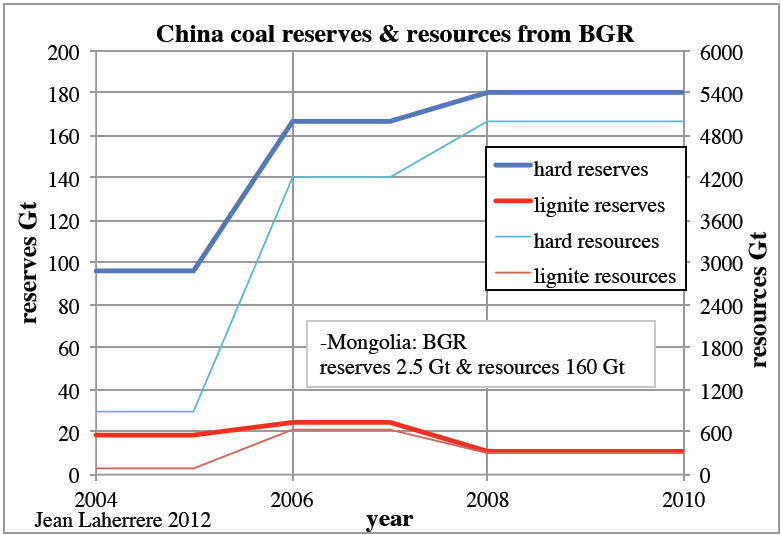
China is importing coal from Mongolia and the BGR estimates Mongolia coal reserves at 2.5 Gt, with resources at 160 Gt.
The data on China coal production and consumption varies with source. After 1999 there’s been an effort to control the wild local mines (where casualties were recurrent) but even so, the increase since 2001 is spectacularly close to 10%/a.
Figure 15: China coal production and consumption from different sources

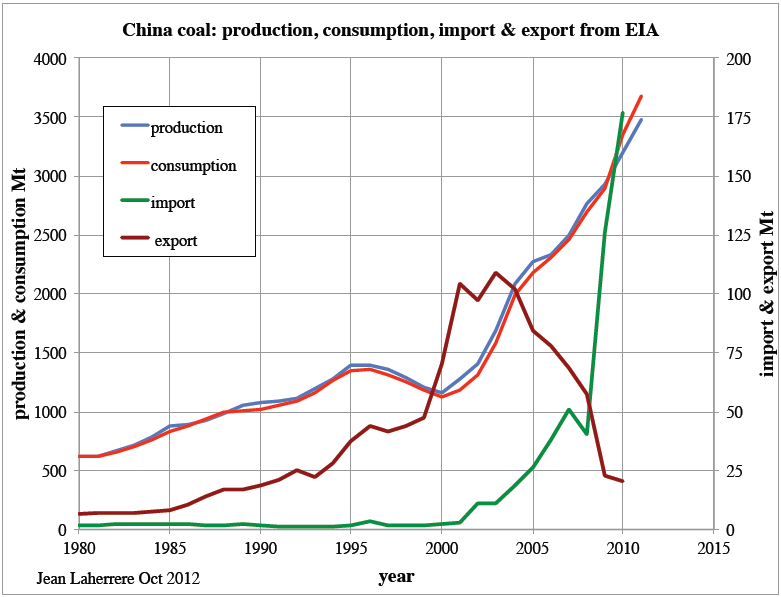
But the most interesting is the evolution of imports and exports using EIA data. Export have been declining since 2003 and imports are drastically increasing since 2008, because consumption diverges from internal production.
Most of data are in tonnes (Mt) but the heat content of coal is variable, it is better to use tonne oil equivalent (toe).
Figure 16: China coal production, consumption, import & export from EIA
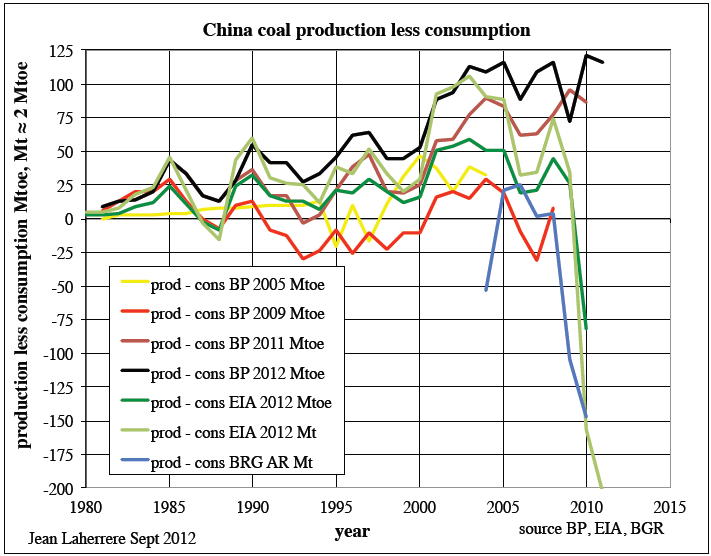
But the story looks completely different using BP data being production less consumption in Mtoe.
The difference from 1980 was around zero for the data found in BP 2009 (in red) but increasing up to 120 Mtoe in 2010 in BP 2012 (in black), when the data from the EIA (in green) is -75 Mtoe. These drastic changes by BP are suspicious and indicate unreliable data.
In 2010 for BP China is a net exporter of 120 Mtoe when for EIA China is a net importer by 75 Mtoe: quite a difference. By looking at the BGR data for China, it seems the numbers reported by BP are wrong.
Figure 17: China coal production less consumption from BP, EIA & BRG
The comparison of the EIA data for the difference between production and consumption, and the difference between export and import shows that these two values are not exactly equal, when in principle one would expect them to be.
Figure 18: China coal production less consumption and export less import from EIA
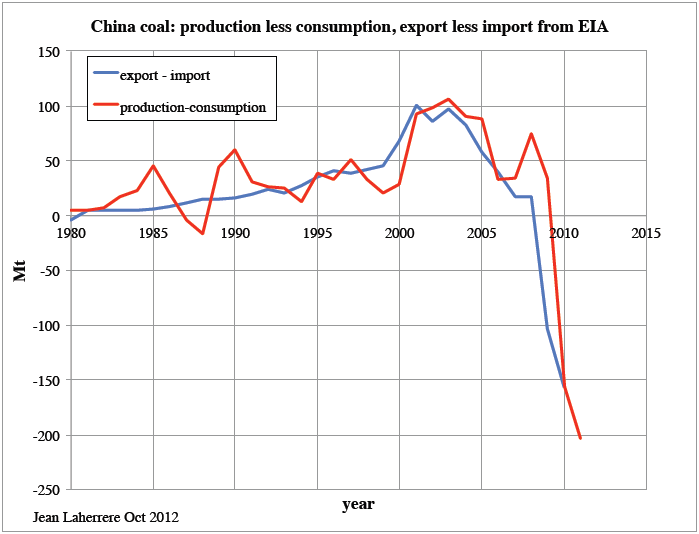
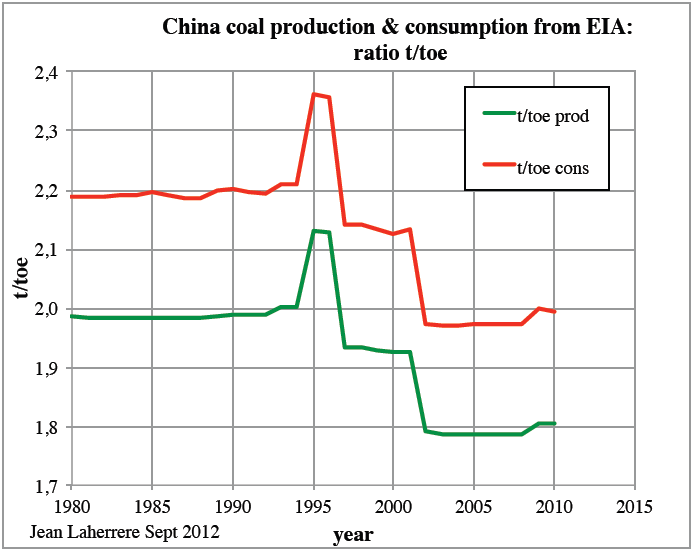
As the EIA reports the production and consumption data both in short ton (1 short ton = 0.907 t) and in toe, it is easy to plot the ratio t/toe which is about 2. But it varies with time and obviously it is not applied in the same way for production and consumption, explaining the slight difference of the above graph. This confirms that China is presently a net importer of coal, despite the BP data! BP has to improve sharply their data, as so the EIA, but in a lesser manner.
Figure 19: China coal ratio t/toe from production & consumption from EIA
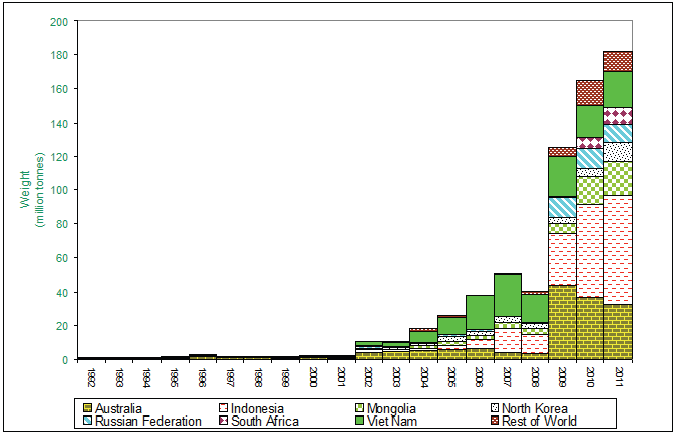
The graph from Chinese customs shows the sharp increase in 2009 of imports from Mongolia, Indonesia and Australia (and also South Africa and Russia).
Figure 20: China coal imports from Chinese Customs
Mongolia is a growing coal producing country with a lot of potential.
The world coal production forecast has to be compared with oil and gas production. The all liquids production is modelled with an ultimate of 3 Tb plus biofuels (maximum 6 Mb/d).
The natural gas production is modelled with an ultimate of 13 Pcf (2.2 Tboe). The impact of the shale gas is in doubt, despite the IEA’s question, “Are we entering a golden age of gas?”, in its WEO 2011, implicitly claiming that today’s production rate can be sustained for over 250 years. The IEA is basing these claims on a very short history of production in recent years in the US (although the first natural gas production in the US started in 1821 in Fredonia to supply the lighting system). There is not yet any commercial production of shale gas outside the US, where the owners of the land, having no right to royalties (in contrast to the US), will do everything to prevent any production, arguing with surface pollution and seismic activity (like recently in Dallas).
The WEO 2012 included a section entitled “Golden rules for a golden age of gas” stating the following:
Yet a bright future for unconventional gas is far from assured: numerous hurdles need to be overcome, not least the social and environmental concerns associated with its extraction
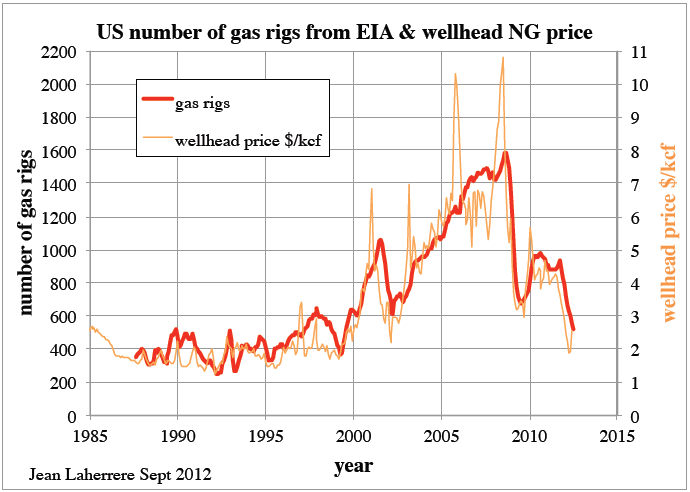
The collapse of the number of gas rigs in the US is due to a collapse of wellhead gas prices, which is ridiculously low compared to the wellhead oil price. This happens because of the lack of gas pipelines (40% of the gas is burned in North Dakota) between new gas production and gas consumption. The lack of new gas pipelines could mean that the long term of the shale gas production is in doubt.
Figure 21: US number of gas rigs and wellhead price
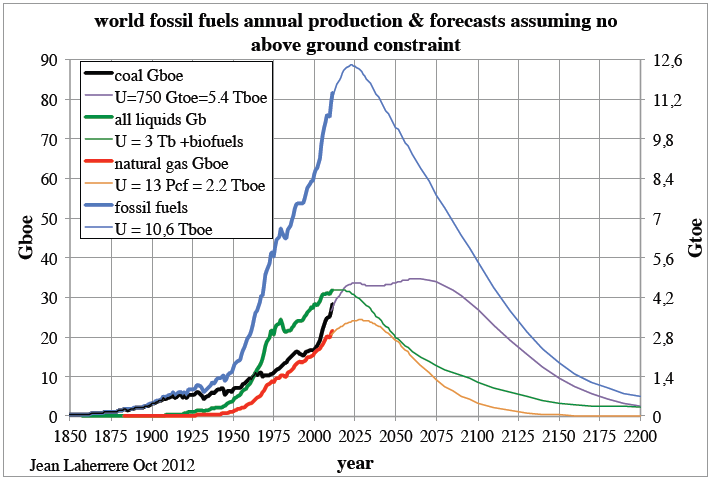
The new updated fossil fuels production and forecast for the period 1850-2200 (displayed in blue) presents a very simple peak centred in 2025.
Figure 22: world fossil fuels annual production & forecast 1850-2200
Using UN 2010 population forecast, the fossil fuels production is displayed per capita and compared to primary energy modelled with an asymptote of 18 Gtoe/a. Up to 2025 this model is very similar to those produced by Exxon, BP, the EIA, the IEA and OPEC.
Figure 23: world primary energy trending towards U = 18 Gtoe as forecasts by Exxon, BP, OPEC and IEA and population
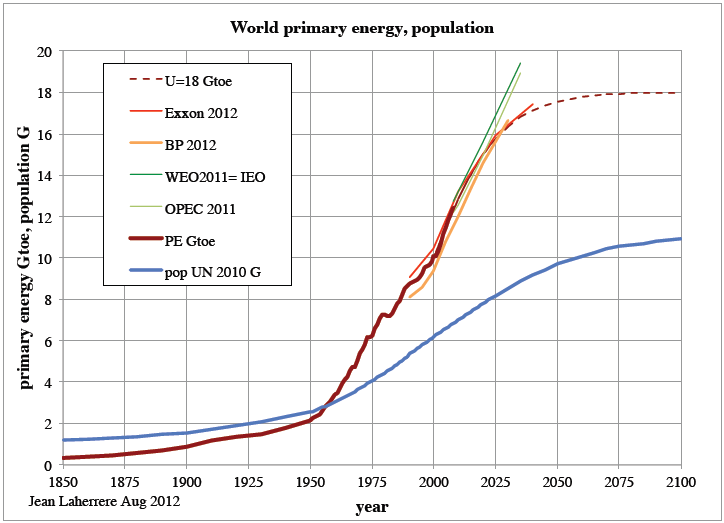
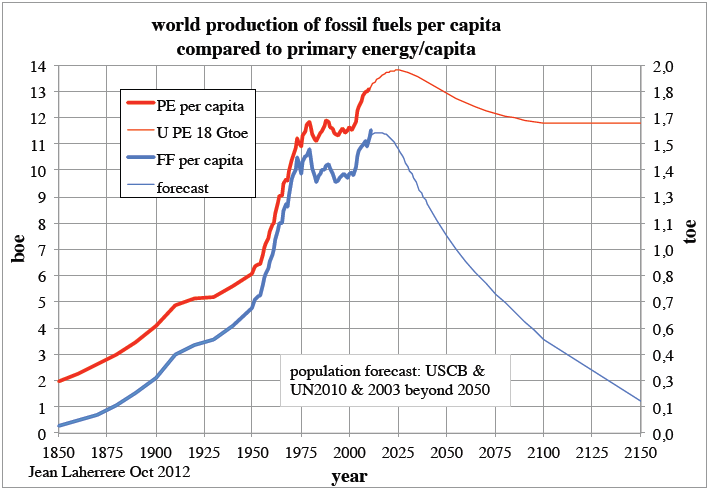
Primary energy per capita is presently 13 boe/a: it could peak at 14 boe/a in 2025 and decline later to 12 boe/a in 2150. But the fossil fuels production per capita is presently 11 boe/a and will stay at this level up to 2025, to then decline sharply down to 1 boe/a by 2150. It means that in 2150 to keep our primary energy flat, 11 boe/a has to be provided by other energy than fossil fuels.
Figure 24: world fossil fuels production per capita compared to the primary energy per capita
The Oil Drum

BillT on Thu, 8th Nov 2012 1:38 pm
At least it is energy equivalent comparisons. But, if it is limited to what can be mined by hand without oil powered equipment and all of the mining needed to mine the ores for the equipment, etc., what is left? Certainly coal will not take us into the 22nd century. Not even close. We got here on the back of cheap, easy, oil power.
The world cannot go back to the 19th century again. Then coal was easy to mine, close to the surface and energy dense anthracite coal, not one-step-up from-wood lignite.
Mother Nature has pulled the plug on the human experiment. The race is on to see if we can survive the rising temperatures or if we will leave the earth to the roaches. I think the roaches have the advantage.