Peak Oil is You

Donate Bitcoins ;-) or Paypal :-)
Page added on March 26, 2016
This Isn’t The 1985 Oil Glut, Dont Expect A 20 Year Bear Market

Summary
Expectations are for oil prices to trend lower in the coming weeks as the recent gains were probably a relief rally.
The dollar should continue to weigh on oil prices through year end as the US economy significantly outperforms markets abroad.
Although we have seen improvements in contango and current prices, the 3.1 billion barrel glut will weigh on the market for some time.
Fears remain that this glut is much like that of the 1980s, but the market is much tighter and OPEC doesnt have the spare capacity.
Cap ex reductions are over done and the price of oil could improve significantly in 2017.
The oil price collapse has been difficult for oil producing states. The US Oil ETF (NYSEARCA:USO) is down over 42% on the year. This is after a big jump from 52-week lows.
(Source: Finviz.com)
There are several reasons for the decline. The first is over production. Production increases were fueled by significant investment due to low rates after the 2008 financial crisis. The Fed kept rates low to keep money moving, and help the US economy along. This event provided more dollars to the US oil industry causing an over investment period. With banks’ lending in a big way to new unconventional oil producers, it added leverage. The ability to get large lines of credit provided capital to buy acreage, add drilling rigs and completion crews. Operators also offered bonds at very low rates. The Fed was forced to think outside the box because of the unique economic issues facing the US. The problem with its uniqueness, is the lack of history to show how QE and prolonged low interest rates will affect the economy long term. It would seem this initially was an exceptional boost for the US unconventional oil industry. But it could be equally as bad when the boom turns bust.
The reaction to the financial crisis stimulated investment, but it decreased the value of the dollar. This increased the price of oil.
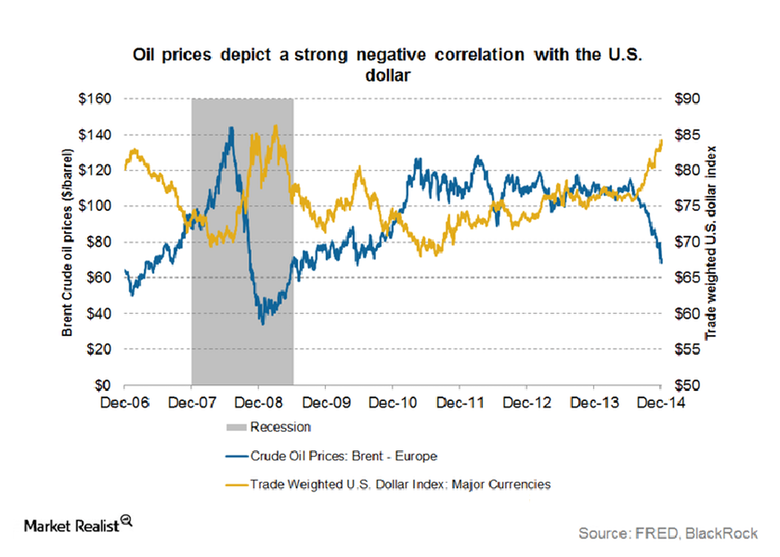
The above chart shows how the dollar and oil price move inversely. If the dollar is worth less, it will take more to buy a barrel of oil. High oil prices also aided operators as it was receiving more for the resource it was selling. This was very important to an industry with very high costs. Initial frac jobs we just 3000 foot laterals with just 5 stages. Water and proppant volumes were a fraction of what it is today. Although less complicated, costs were significantly higher. These very small jobs took much longer than complex well designs of today. Many thought unconventional liquids production wouldn’t be economic for decades, but costs decreased. Without high oil prices, the exploration phase would have been much slower.
The US economy has improved, but the rest of the world has not been as lucky. US demand for gasoline has been the main reason why more crude has been refined. Over the past few weeks, record gasoline demand for this time of year has been seen. It has grown from 9.1 million bbls/d to 9.4 million. There are high hopes for the upcoming driving season as gasoline is averaging just $2/gal. Europe, Russia, Brazil, and the Middle East have all been struggling. Some of this is due to sanctions. Low oil prices are another issue. More importantly, the rest of the world is still recouping from 2008. China has other issues. Its economic build out looks over extended. This economy may be over levered. It is trying to transition to a service based economy, and this has affected growth. Another issue is OPEC. OPEC, mainly Saudi Arabia, has been the swing producer. It had been entrusted with the responsibility of keeping the world oil markets balanced. If crude demand would decrease, OPEC would cut supply. As a monopoly, it had a great deal of control over world oil prices in the past. When spare capacity was high, OPEC could easily flood the market or leave it under supplied as it wished. Both its control and position as the swing producer have now changed. Many think OPEC has pushed down oil prices on purpose for political reasons. Some of this may be true, but the main reason goes back to the oil glut of the 80s.
In the early 80s, the price of oil pushed higher. This had some to do with the oil embargo and Iran crisis. During this time oil investment increased but the world economy began to slow. Just like North American shale added production recently, the North Sea was an OPEC fear in the early 80s. This was exacerbated by energy saving initiatives (much like Obama’s Cash-For-Clunkers Bill). In 1978, the average car fuel economy was 17 mpg. This increased to 22 mpg in 1982. This decreased US oil imports from 46.5% in 1977 to 28% in 1983. In 1986, the price war began. When supply outpaced demand, OPEC decided to cut. The majority of this was done by the Saudis, but other OPEC members continued to increase production. Saudi Arabia decreased production from 9 million bbls/d in 1981 to 3.1 million bbls/d in 1985. OPEC members preceded to steal Saudi customers. The Saudis tried to increase production, but weren’t able to get the majority of its customers back. This is why it decided not to be the world’s crude swing producer anymore. The announcement pushed oil prices down to $10/bbl in March of 1986 from a peak of $32/bbl in November of 1985. Another reason the Saudis have abandoned its swing producer role, is it is no longer effective. OPEC members will not stick to production limits. Non-OPEC members cheat as well, and there is no controlling US production.
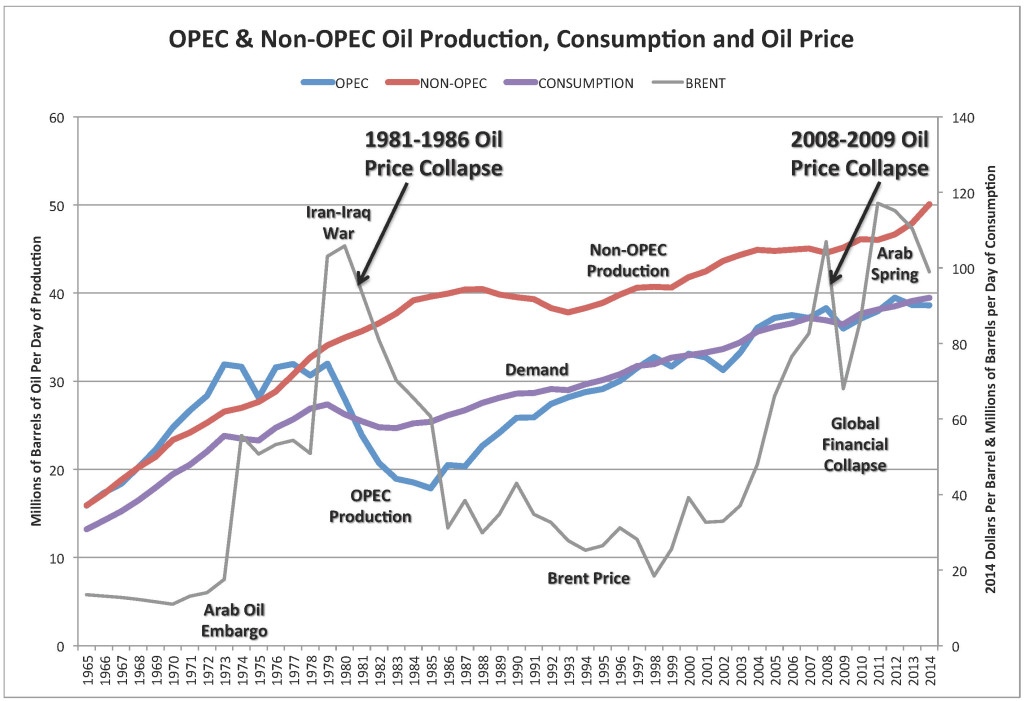
(Source: BP, EIA and Labyrinth Consulting Services, Inc.)
Although the oil price drop has been much like that of 1986, there are some significant reasons it is different. The precipitous drop was followed by a fairly consistent oil price for almost 20 years. Some believe the same will occur today, but OPEC cannot control prices as it once did. In 1965, world consumption was below OPEC and non-OPEC production. This kept prices low. OPEC accounted for half of the world’s production. Technology to find and gather crude has increased non-OPEC production. Since much of non-OPEC production isn’t state run, it can’t be shut off. OPEC can turn off the taps whenever it wants, but private/public companies cannot be controlled. Operators in the United States, Norway or possibly Russia (we will have to see if the production freeze holds up) work based on supply and demand. While production is greater than demand, currently the world is producing approximately 1 to 2 million more barrels per day than demand.
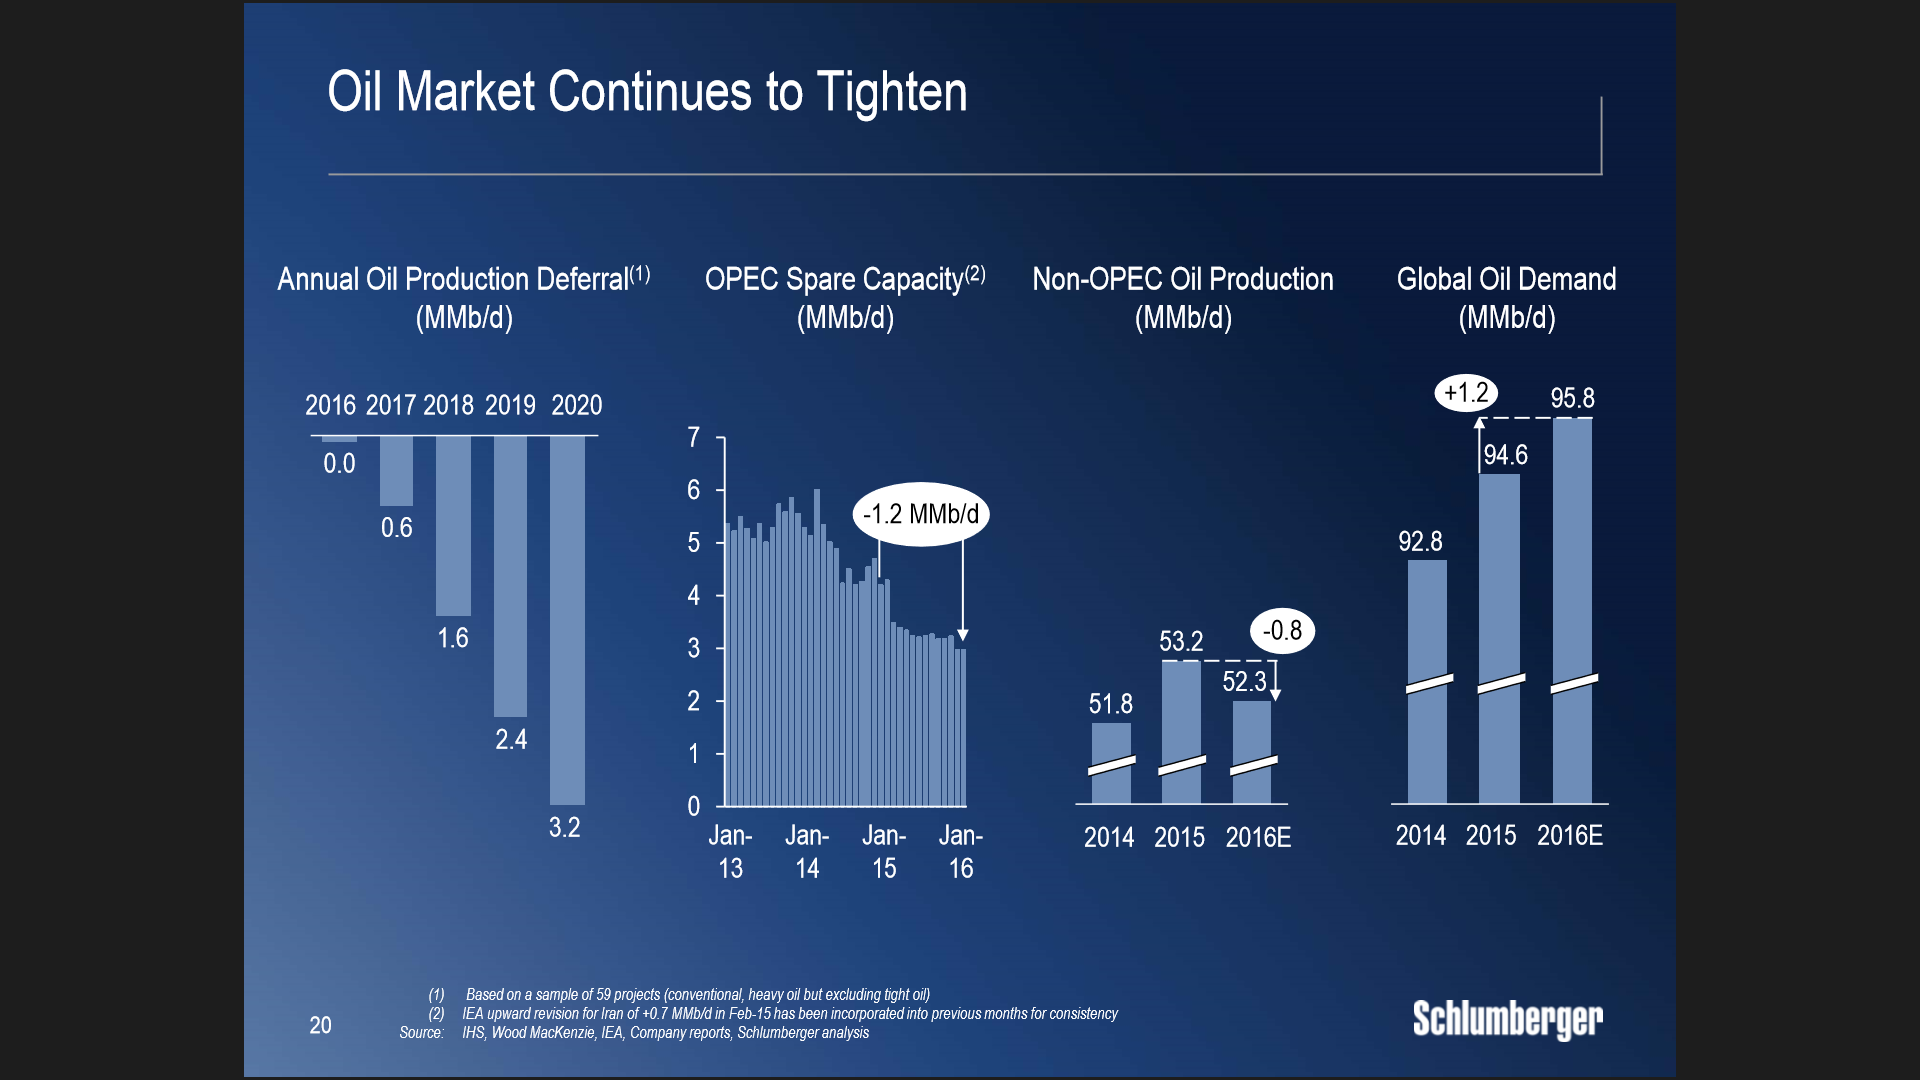
(Source: Schlumberger)
Schlumberger (NYSE:SLB) states total demand is approximately 94.6 million barrels per day. This is just 1.5% and could easily balance with increased demand. Expectations are for a demand increase of 1.2 million Bo/d. The 80s glut had total oil production of approximately 68 million barrels per day, while demand slipped to 60 million barrels per day. Overcoming a 11.8% overhang was a more difficult issue. OPEC spare capacity also continues to decrease. Lower oil prices turn into lower gasoline and diesel. As a general rule, when fuel is cheaper people drive more. Companies that use significant volumes benefit as well. This creates jobs, so more worker’s drive to their place of employment. It is possible that lower oil prices won’t provide a lift to the economy, at least until rates begin to rise.
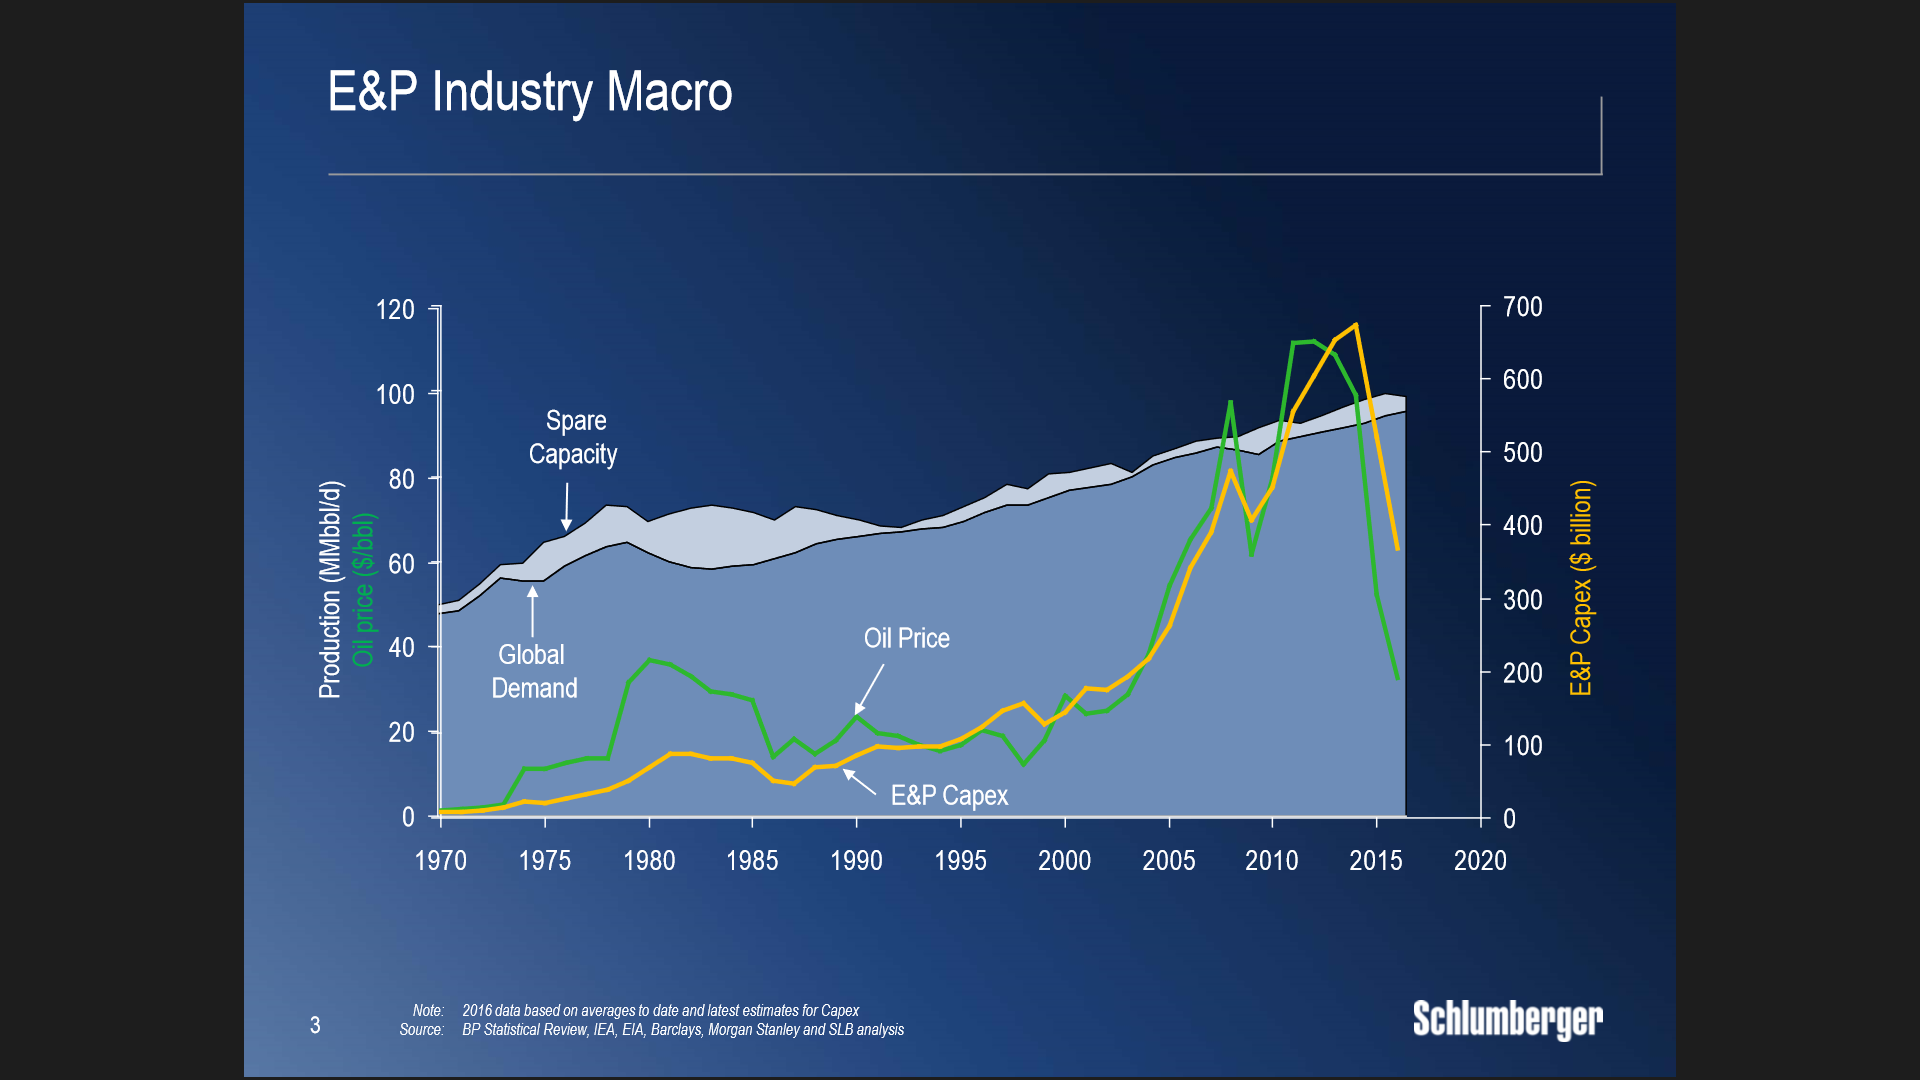
The slide below provides some interesting data points to consider. When looking at the supply/demand dynamic, it is important to show the market is tighter than in years past. Spare capacity from the early 70s to the late 80s was wider from a production standpoint. This was magnified as a percentage because demand is greater now. E&P capex is also important as $300 billion has already been cut. The chart is a little overwhelming when compared to previous decades. This is a product of higher oil prices which will lend to increased market volatility. Many already know this, but when oil prices increase, it opens the door to technology finding and producing new resource. This is the case for shale and other unconventional means. I’m not saying that frac’ing just recently started, as it has been used for decades. But its successful wide range liquids based broad usage is. A more important technology may be deep sea drilling.
(Source: Schlumberger)
Recent advances have allowed for production in very deep water through the use of high spec drill ships. These projects produce very large volumes of resource, but take years and cost billions. A large number of contracts have been cancelled, and some believe this could cause a shortage of oil in 2017 or 2018. Whether shale can pick up the slack is difficult to know until we see what canceled project does to supply longer term.
Production decreases in the US have been a focus. Due to the EIA, we have a more transparent market than other countries. This makes it very difficult to track inventories of world oil hubs. Estimates have 3.1 billion barrels in storage, and 532 million of these are in the US. At the end of January, Saudi Arabia had 314 million bbls of crude stored.
(Source: Bloomberg)
Although many countries are at or near its production ceiling, we are still seeing growth from both Iran and Iraq. Iranian production is charted below.
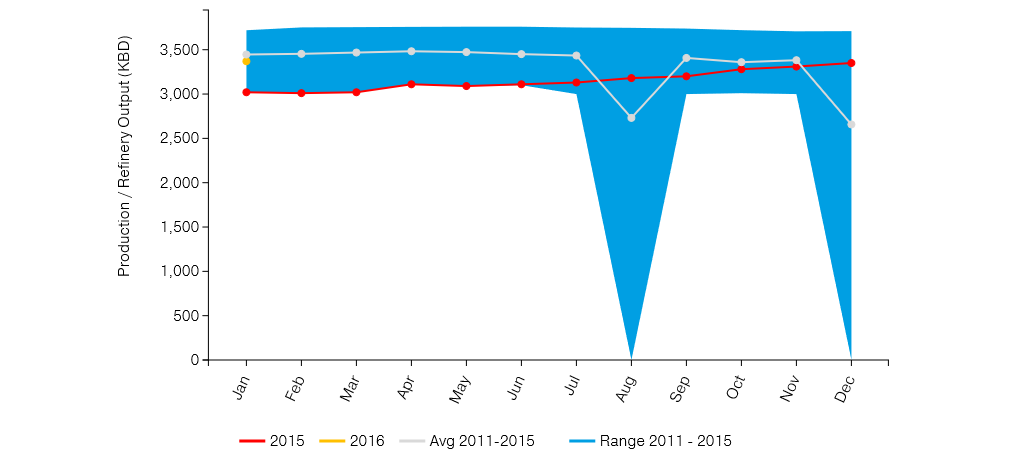
(Source: JODI)
Iranian production is interesting, as it began ramping in 2015 in preparation of having sanctions removed. In January of this year, it finally reached its three-year average. Iran has more than withering infrastructure to worry about. Increasing production may be difficult, but finding storage may be its most limiting factor. Saudi Arabia and other Sunni nations have not been receptive to leasing storage to Iran. This is why Iran has approximately 50 million bbls in floating storage. It has also had difficulty in finding customers, although France has made purchases.
Iraqi production has increased significantly. The chart below provides data through the end of January of 2016.
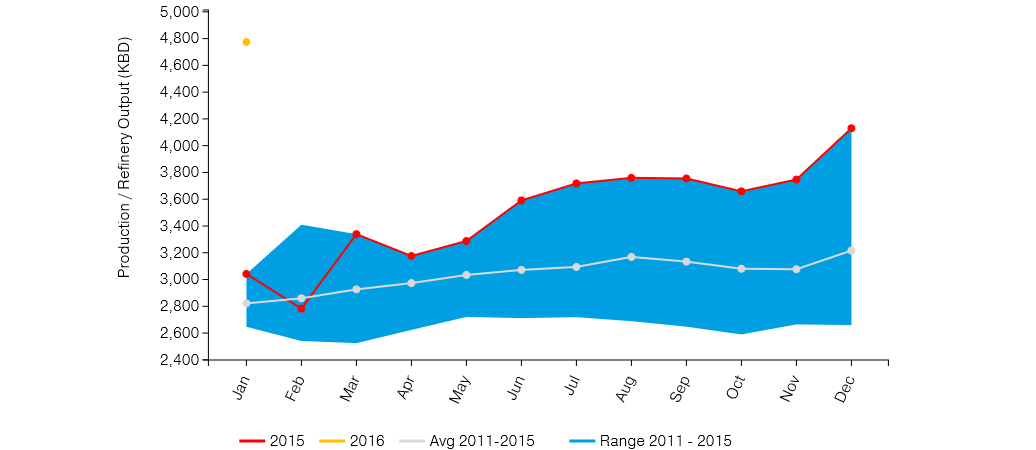
(Source: JODI)
Iraq production has escalated well over its 2011 to 2015 average. It is possible production increases could continue as well. Syria could also increase production, but a resolution to its civil war seems far off.
The US continues to see production decreases of approximately 20 thousand bbls/d on a weekly basis.
(SOURCE: EOG)
EOG Resources has provided this slide that tracks EIA US crude oil production estimates through the end of 2017. We have already decreased production by almost 700 thousand bbls/d. Further drops are expected, with the lowest rate in 2017. Currently, the EIA thinks total US crude production will decrease by 1.5 million bbls/d.
Over the past 6 months, global oil production has decreased by 1.37 million bbls/d.
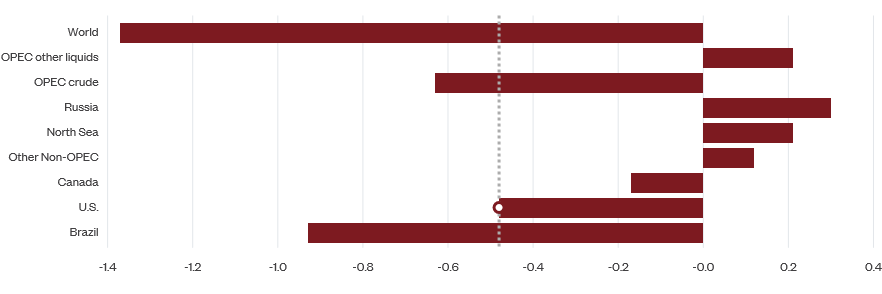
(Source: DOE, Bloomberg)
These estimates have Brazil decreasing production by 900K bbls/d. OPEC has dropped 600K bbls/d and the US 500K. Nigerian supply took a major hit decreasing by 300K bbls/d in mid-February due to the closure by Shell of the Forcados export system after damage to a pipeline. Another 192K bbls/d were revised down as well. Iraqi exports were decreased by approximately 600K bbls/d after a pipeline disruption for approximately one months. Now 150K bbls/d may be off line for a while, as Iraq wants a new agreement from the Kurdistan Regional Government. Kurd production is declining as well. Its Taq Taq field reduced 50K bbls/d over 2015. Venezuelan production has decreased 165K bbls/d since the war on shale began in 2014.
The market has been focused on other data points as well. Contango has tightened up some, making it less profitable to store oil. The difference between the front month and 7 month futures narrowed from $5.07/bbl to $2.79/bbl. This isn’t as big of a factor inland, but offshore is much more expensive.
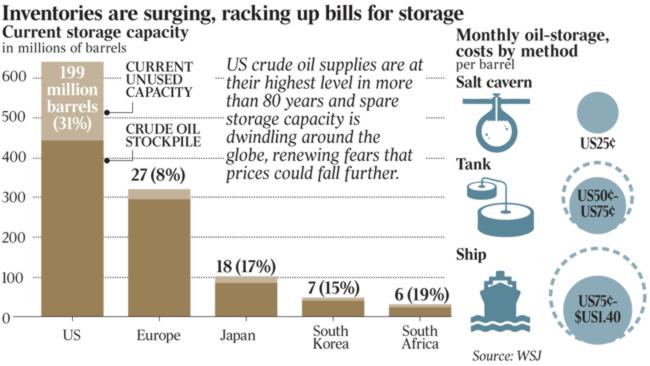
The above oil storage costs are from 2015, so may be a little off. It still provides an idea of the differences per barrel. When much of the tanks filled, it has become very difficult to obtain cheap storage. Over the last six months, storing oil on ships would have been at a loss.
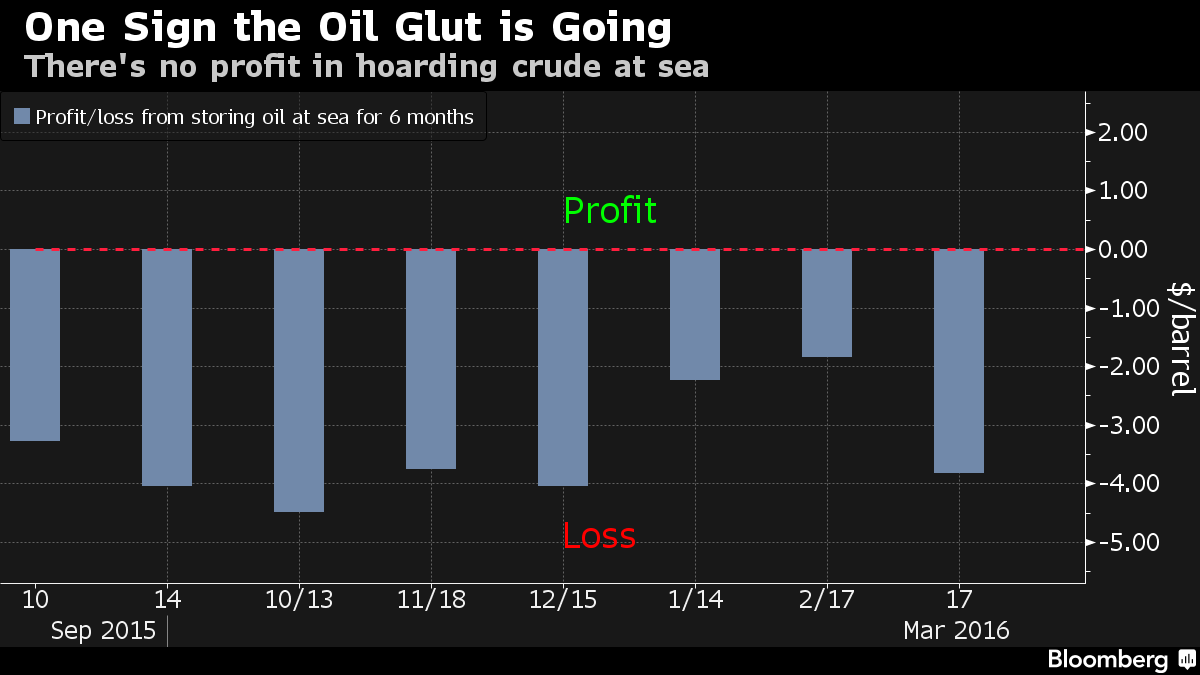
The tightening of contango is not the only reason, as rising freight costs also are the reason. Month over month, day rates are up 21%.
In summary, the oil markets have begun to heal but it will take time. Although we have 3.1 billion bbls of crude stored, the world will be consuming 96 million bbls/d by the end of 2016. The current glut has taking a significant number of days to work through, but this is based on a much lower spare capacity in OPEC and non-OPEC producers. In the 80s, oil hubs filled up quickly as supply outpaced demand by a much higher number. Gasoline demand is robust, and we could see a record driving season in the US. International economics are by no way as good, and will continue to drag on the market. We believe the recent run up could be just a relief rally, and oil could move back to the $32 to $34 range in the coming weeks. Although data has improved, it will take time. Much of the recent move was on dollar weakness, as the Fed mistakenly thought a dovish statement would maintain dollar strength when in fact it caused a decline. We think the market could still see three rate increases this year, and April is a possibility. Strength in the Euro after very negative comments on the European economy is a bit of a head scratcher, but it could be a short term issue. Even with US production on the decline, we continue to add to storage. This is indicative of the 9.4 million bbl add last week. It is possible we see inventory draws during the driving season, but we could see another pullback after. Even if US production begins to decline at a faster rate, we have huge volumes of cheap imports. The dollar could continue to strengthen, and we believe there is upside from here. There is little reason for the big pullback seen based on economic conditions in the US and abroad. Our view is oil will trade between $32 and $49 over the course of the next 3 to 6 months.
There are several other ETFs that focus on U.S. and world crude prices:
iPath S&P Crude Oil Total Return Index ETN (NYSEARCA:OIL) ProShares Ultra Bloomberg Crude Oil ETF (NYSEARCA:UCO) VelocityShares 3x Long Crude Oil ETN (NYSEARCA:UWTI) ProShares Ultrashort Bloomberg Crude Oil ETF (NYSEARCA:SCO) U.S. Brent Oil ETF (NYSEARCA:BNO) PowerShares DB Oil ETF (NYSEARCA:DBO) VelocityShares 3x Inverse Crude Oil ETN (NYSEARCA:DWTI) PowerShares DB Crude Oil Double Short ETN (NYSEARCA:DTO) U.S. 12 Month Oil ETF (NYSEARCA:USL) U.S. Short Oil ETF (NYSEARCA:DNO) PowerShares DB Crude Oil Long ETN (NYSEARCA:OLO) PowerShares DB Crude Oil Short ETN (NYSEARCA:SZO) iPath Pure Beta Crude Oil ETN (NYSEARCA:OLEM)
4Q16 may trade in a range of $45 to $55. We believe the average oil price range for 2017 will be $55 to $65. Prices may be appreciably higher in 2018, as natural increases in oil demand coupled with natural oil production declines balance the market and position it for growth. This is based partially on our belief OPEC will cut (this is a big if) and gross under expenditures on E&P capex. Looming defaults will also weigh, providing a lift to prices. Expenditures in the Permian and SCOOP may drive US production while the Eagle Ford follows at a lower growth rate. Bakken production may continue to decline, as its need for more refining capacity becomes more apparent.
Disclosure:I am/we are long DWTI.
I wrote this article myself, and it expresses my own opinions. I am not receiving compensation for it (other than from Seeking Alpha). I have no business relationship with any company whose stock is mentioned in this article.
Additional disclosure: Data for the above article is provided by welldatabase.com. This article is limited to the dissemination of general information pertaining to its advisory services, together with access to additional investment-related information, publications, and links. Accordingly, the publication of articles should not be construed by any consumer and/or prospective client as a solicitation to effect, or attempt to effect transactions in securities, or the rendering of personalized investment advice for compensation, over the internet. This information is provided for guidance and information purposes only. This information is not intended to provide investment, tax, or legal advice. The information contained herein has been compiled from sources deemed reliable and it is accurate to the best of our knowledge and belief. However, I cannot guarantee its accuracy, completeness, and validity and cannot be held liable for any errors or omissions. All information contained herein should be independently verified and confirmed. Hartstreet LLC does not accept any liability for any loss or damage whatsoever caused in reliance upon such information. Readers are advised that the material contained herein should be used solely for informational purposes. Information presented is for educational purposes only and does not intend to make an offer or solicitation for the sale or purchase of any specific securities, investments, or investment strategies. Investments involve risk and unless otherwise stated, are not guaranteed. Be sure to first consult with a qualified financial adviser and/or tax professional before implementing any strategy discussed herein.
9 Comments on "This Isn’t The 1985 Oil Glut, Dont Expect A 20 Year Bear Market"
Plantagenet on Sat, 26th Mar 2016 6:27 pm
The claim in this article that the oil glut is ending because it isn’t profitable to store oil at sea is nonsensical. The only reason to store oil at sea is to make a profit by selling at a higher price. The lack of profitability associated with this oil con tango strategy is due to continued low prices and a continued oil glut—-it definitely does not signal an end to the oil glut;
Similarly the claim that OPEC has no more excess capacity when Iran—an OPEC member—does in fact have excess capacity and is ramping up their exports right now is more silliness.
Finally, the article may be right that KSA and OPEC will cut their oil production voluntarily by the end of the year….but so far there is no sign of that happening and until that happens the oil glut is likely to continue.
Cheers!
makati1 on Sat, 26th Mar 2016 8:07 pm
Oily numbers from questionable sources.
More guessing. Nothing real. But that won’t stop the oily investors here from defending the dream.
“Offshore Lease Sale Disrupted by Protestors Shouting “Shut it Down”
“Oil falters as widespread strains halt momentum”
“Oil Security Seen at Risk by IEA on `Historic’ Spending Cuts”
“Wood Mac Sees Deferrals in Global Oil, Gas Projects Reaching $500B in 2016”
“US Oil Rigs Resume Slide, Drop By 15 In Past Week To New Record Low”
“Shale Euphoria: The Boom and Bust of Sub Prime Oil and Natural Gas”
“UK Oil Industry Gets Tax Break, Too Little Too Late”
“Can Scotland Save Its Oil Industry?”
“Oil and gas bondholders have lost $150 billion in oil price hit”
“Refining: This Oil Sector Hasn’t Crashed Yet… But It’s About to”
“A Glimpse Of Things To Come: Canadian Oil Company Liquidates Hours After Bank Demands Repayment”
“Outlook for The US Offshore Industry Is Darkening”
And on and on… http://ricefarmer.blogspot.fr/
Pass the popcorn.
geopressure on Sat, 26th Mar 2016 9:02 pm
makati1
What is posting a bunch of mainlines from the mainstream media supposed to prove???
If you are reading articles in the mainstream media & believing them, then the beliefs / opinions that you develop are guaranteed to be wrong…
—
People who understand what is really going on don’t write articles or appear on FBN to generously share knowledge with the world… & if they attempted to do such, they would be stopped…
Your headlines are meaningless babble aimed at controlling the thoughts of the general public – not unlike yourself…
geopressure on Sat, 26th Mar 2016 9:05 pm
The Glut is ending because there never was a glut & the US’s SPR / Commercial Storage is empty so they can no longer maintain the illusion of a glut…
It is Known…
makati1 on Sat, 26th Mar 2016 9:20 pm
Geo, if you don’t read from ALL sources, not just the US MSM, how can you possibly get any idea of reality? You will NOT see it next door to your house or on any US media. I could have listed 1,000 times that number to prove my point, but Rice Farmer has a nice list easily available.
I read an average of 30-40 articles daily from all over the world, but few from the Us because the propaganda level is ridiculous there.
I also do not live in the US Police State and can see for myself what is happening in Asia. My world view is from actually traveling around the ME and Asia in the last 10 years and having connections in many countries. What is the basis for yours?
Boat on Sat, 26th Mar 2016 9:37 pm
“People who understand what is really going on don’t write articles or appear on FBN to generously share knowledge with the world… & if they attempted to do such, they would be stopped”
A conspiracy from la la land eh?
US’s SPR / Commercial Storage Commercial Storage is empty>?
You got links or is is this information only known by the “Known”.
Boat on Sat, 26th Mar 2016 10:49 pm
the backlog of DUCs is already shrinking in some areas
http://www.reuters.com/article/us-usa-shale-ducs-idUSKCN0WN0BK
rockman on Sun, 27th Mar 2016 10:27 am
A lot of words to explain how 2016 is different the 1986 when it comes to oil. Here’s the Reader’s Digest condensed version: since 1986 the world has consumed about 800 BILLION BBLS of the planet’s finite oil resources.
As said before it ain’t rocket science no matter how complicated one tries to explain it. LOL.
Bloomer on Sun, 27th Mar 2016 10:45 am
Its takes a lot of investment dollars to quench the global thirst for crude oil. Low oil prices has already put a halt to new development projects and some wells are shutting in. If the Fed does raise the cost of borrowing, it will become even more expensive to put any new capacity back on line. Short crude at your peril, the long-term trend in oil prices is up.