Peak Oil is You

Donate Bitcoins ;-) or Paypal :-)
Page added on February 3, 2016
The Most Prolific Natural Gas Region Is In Decline

Summary
In this piece, I decided to examine the decline rates, rig counts, and rig productivity numbers to see what the future looks like for the Marcellus shale.
According to my findings, it looks as though output in the region is slated to fall hard this year unless rig counts rise materially.
As the most prolific natural gas-producing region in the U.S., this should prove to be very bullish for investors with exposure in this space moving forward.
In a previous article, I decided to analyze oil production and the trend that it should take for the Marcellus shale, one of seven major oil- and gas-producing regions regularly covered by the EIA (Energy Information Administration). As a result of my work, I was able to put together a comprehensive picture of the oil market that allows me to figure, within reason, how U.S. oil production should decline. At the suggestion of one of my writers, I decided to look at the same thing for the natural gas market and I was able to conclude that the Marcellus, America’s most prolific region for the production of natural gas, is at risk of seeing production plummet in the months to come, a move that would be undeniably bullish for investors in this space.
A look at the Marcellus
In the image below, you can see that the Marcellus shale is located, for the most part, throughout West Virginia, Pennsylvania, and parts of New York. Although it overlaps with the Utica, which stems into Ohio, it’s important to keep in mind that these are two different plays according to the EIA. As an example of the differences, the average decline rate of wells in the Utica is about 0.5% higher per month and rig activity results in about 26% less production, on a per unit basis, than what operators can get from its larger Eastern cousin.
(click to enlarge)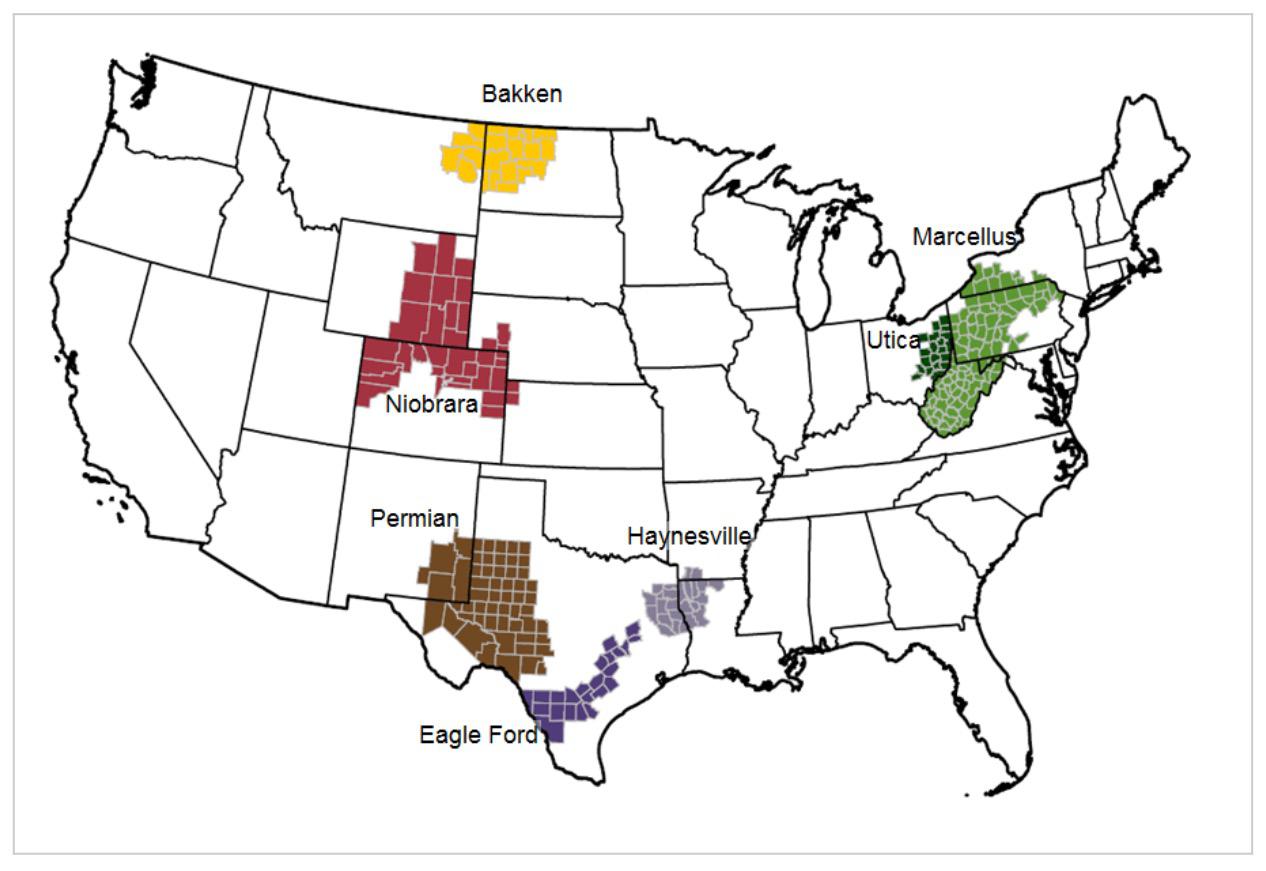
*From the EIA’s Drilling Productivity Report
What’s more is that the Marcellus is, quite literally, the most prolific natural gas region in the country. According to data provided by the EIA, the region produced an estimated 15,659,921 Mcf of natural gas per day during December of 2015. This is equal to about 2.61 million boe (barrels of oil equivalent) per day and makes the region account for 35.2% of total natural gas produced between the EIA’s seven regions. Given its overwhelming prominence, there likely aren’t many energy investors who haven’t heard of the region. In the table below, you can see how output in the area compared to the Niobrara, Permian, Utica, Haynesville, Eagle Ford, and Bakken last December.
(click to enlarge)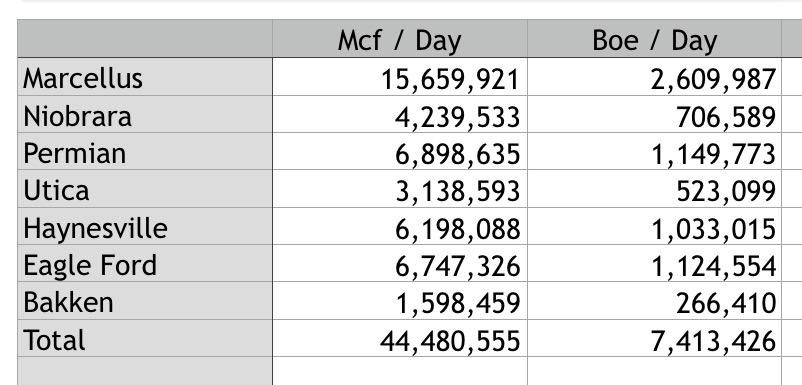
*Source: Created by author with data from the EIA’s Drilling Productivity Report
Unfortunately, complete natural gas production statistics for the U.S. as a whole are not available as of the time of this writing for the month of December last year, but data for November is. Using the EIA’s estimates, it seems that these seven regions account for about 56.2% of national output, which means that the Marcellus makes up 19.8% of all output throughout the country. No matter how you stack it, that’s a large piece of the overall pie.
Setting the ground rules
As oil prices have plummeted and production has come offline, so too has the natural gas industry been hit to some extent. After seeing output rise throughout a good portion of 2015, the Marcellus saw production peak at 16,204,159 Mcf per day (or about 2.70 million barrels per day) in June. Since then, the drop has averaged roughly 90,706 Mcf per day on a monthly basis, or approximately 15,118 boe per day. Interestingly, however, as the number of rigs in the region drops, the decline in output should grow greater. In order to figure this out, however, I had to make some reasonable assumptions.
(click to enlarge)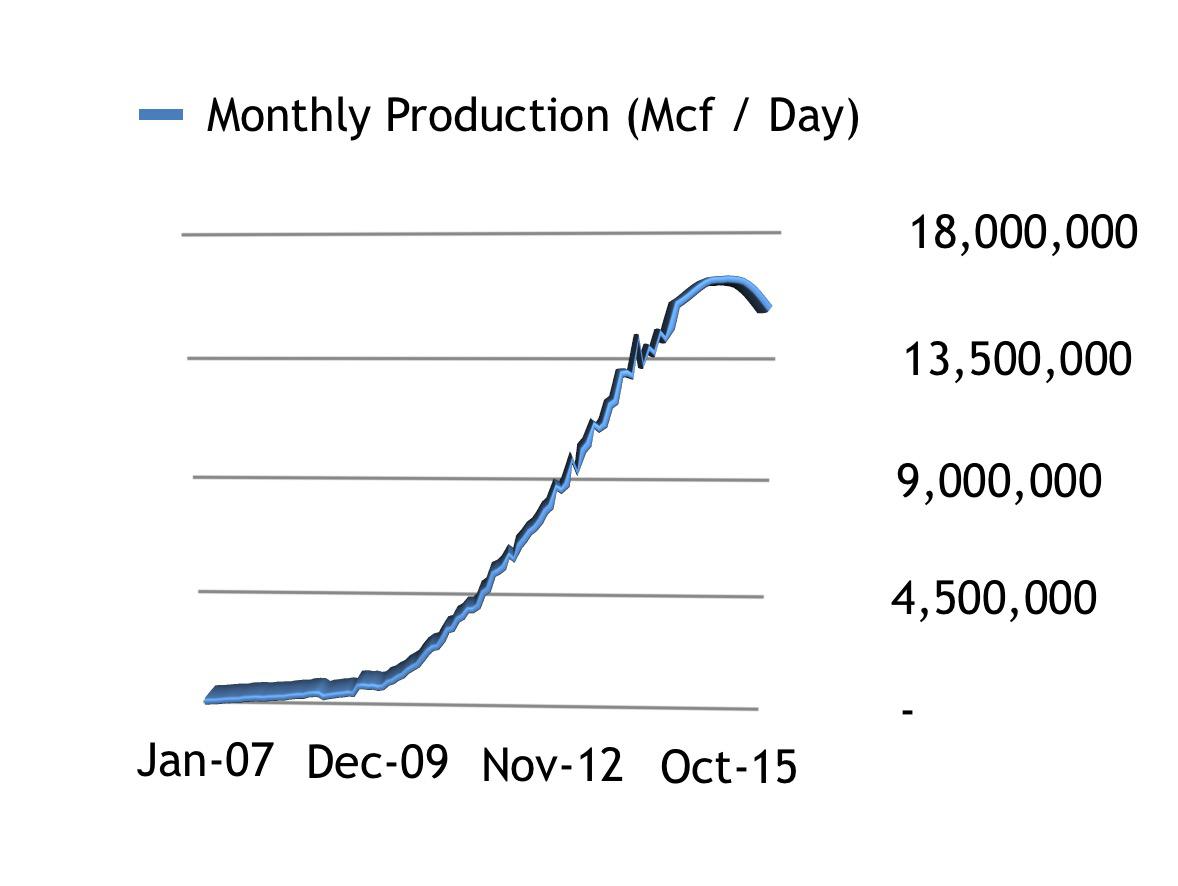
*Source: Created by author with data from the EIA’s Drilling Productivity Report
In the graph below, you can see the historical decline rate of wells in the Marcellus. Over time, as drilling has been curtailed and as many companies in this space are likely trying to milk out every last bit of natural gas, decline rates have soared to around 4% per month. As a result of this trend, I will be assuming three different scenarios for decline rates moving forward; 3% for a conservative estimate, 4% for a moderate estimate, and 5% for what the data could look like if decline rates continue to grow.
(click to enlarge)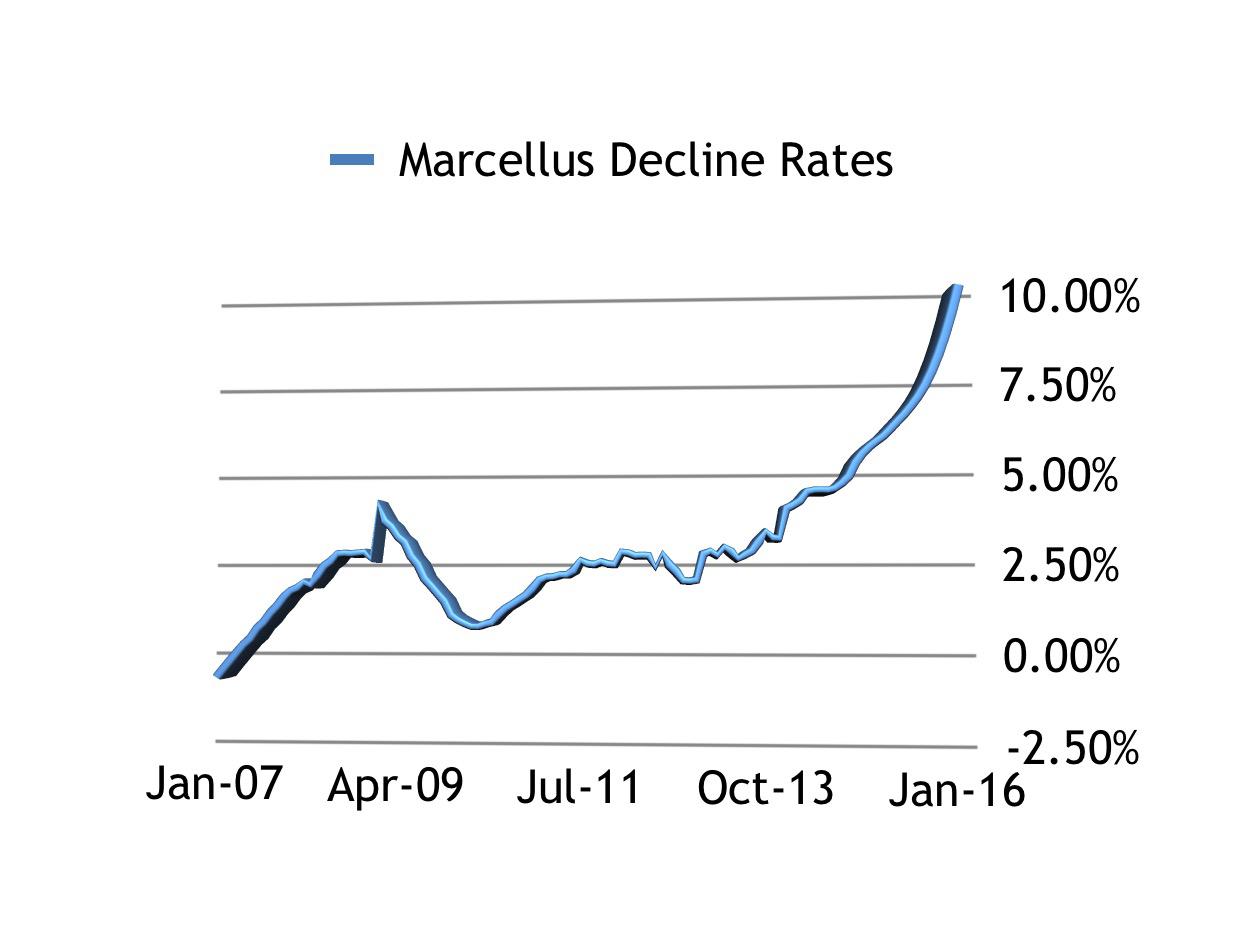
*Source: Created by author with data from the EIA’s Drilling Productivity Report
In addition to this, I had to figure out what to use for a change in the rig counts moving forward. In my last piece on the Marcellus (linked in the introduction to this article), I explained my rationale for assuming that rig counts fall by four units each month (absent a move higher in prices). I am sticking to this base assumption for the purpose of my analysis but, thanks to the Baker Hughes (NYSE:BHI) rig count that is released weekly, I’m able to assume that January rig counts should be 34 units as opposed to my previously-forecasted 38 units.
(click to enlarge)
*Source: Created by author with data from the EIA’s Drilling Productivity Report
Finally, I had to forecast what the situation should look like regarding rig productivity. In the graph above, you can see that the trend for improved month-to-month productivity gains has been extremely volatile but that the past year or so has seen an average improvement sloping up toward 1% or so per month. According to the EIA, the most recent month’s improvement came in at 1.49%. Although the actual numbers may be materially higher or lower than they are today, I’m going to use this as a baseline and project continued month-to-month improvements of 1.5%.
Production looks set to fall… hard
After incorporating these assumptions, I was able to plot out where I think natural gas production should be in the months to come. Assuming a 1.5% improvement in productivity each month, decline rates of 3%, 4%, and 5%, and a four-rig drop each month, we can see in the table below that the output forecast for the Marcellus region does not look all that great between now and December of 2016.
(click to enlarge)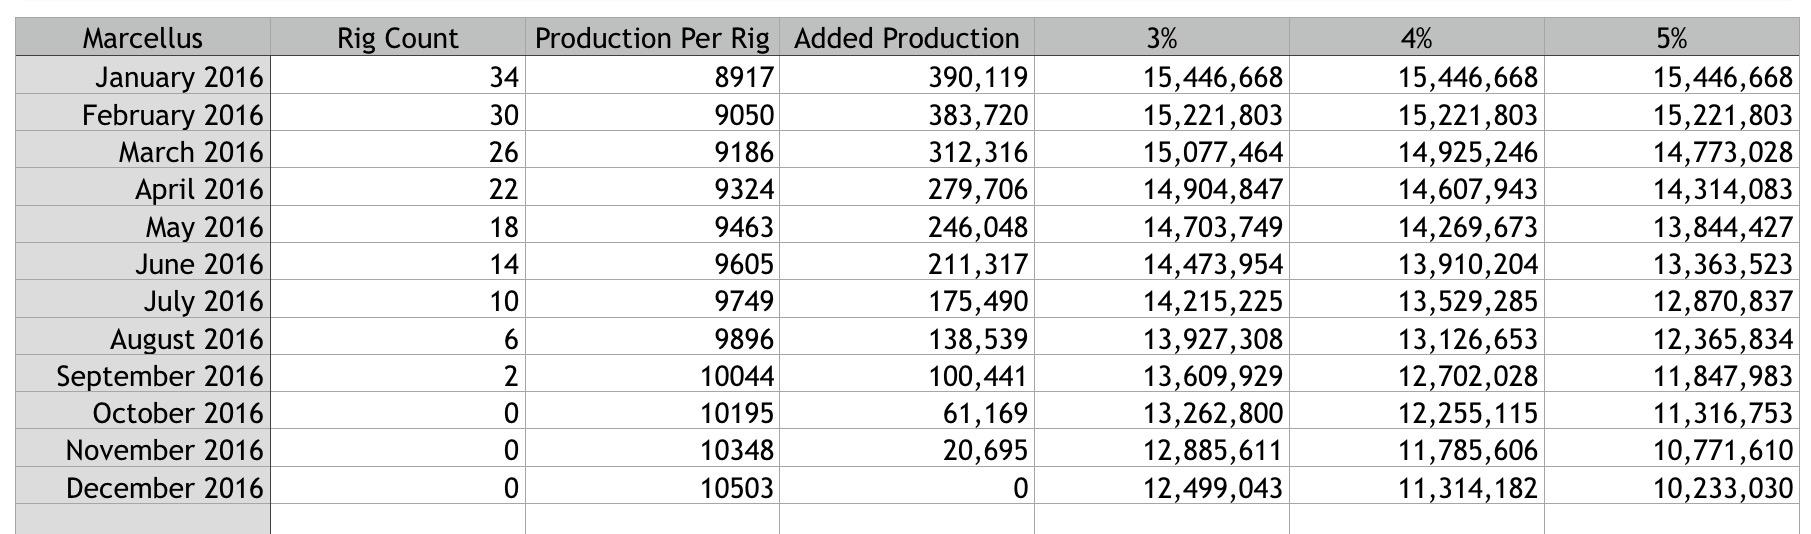
*Source: Created by author with data from the EIA’s Drilling Productivity Report
If my assessments are accurate, the conservative forecast would imply that natural gas production for the area should average about 12,499,043 Mcf per day by the end of this year, which translates into about 2.08 million boe per day. This implies a decline of about 20.2% year-over-year. In the more moderate scenario, which seems to be realistic given current decline rates, the drop could be far more severe. Between December of 2015 and December of this year, output could decline by 27.8%, while the liberal forecast suggests a drop of 34.7% year-over-year.
To put this in perspective, the conservative assumption would, if natural gas production is to remain constant in all other regions (which won’t happen), means that daily production across the U.S. would decline by 0.7% per day. The moderate assumption suggests production would be down by 0.9% per day, and the liberal assumption would mean a decline of 1.1%. When you consider the fact that the general trend for consumption has been higher year-over-year, and that other regions are also likely to see output fall if the market does not recover, this could help to push natural gas prices up materially.
Takeaway
Based on the data provided by the EIA, it seems that the tide has already started turning when it comes to natural gas production but that the months ahead will likely see a much larger drop in output than anything we’ve seen so far during this cycle. Of course, if my assumptions regarding the oil rig count, drilling productivity, and/or decline rates turn out to be wrong, this picture could change. However, from what I’ve seen by looking at the historical data, it appears as though some sort of drop in output is highly probable for the foreseeable future and investors should keep a close eye on this space.
18 Comments on "The Most Prolific Natural Gas Region Is In Decline"
GregT on Wed, 3rd Feb 2016 2:13 pm
The Marcellus needs your help. Please join us at: http://WWW.Marcellus.Cheerleaders.org
Together, we can make a difference.
(Donations graciously accepted)
GregT on Wed, 3rd Feb 2016 2:14 pm
We put the ‘M’ in mighty!
Apneaman on Wed, 3rd Feb 2016 2:17 pm
These oil and gas people are the most prolific fuck ups around. Incompetent clowns and getting worse every year.
California’s Methane Leak Passes 100 Days, and Other Sobering Numbers
The Aliso Canyon gas leak is the latest fossil fuel disaster to elude attempts at a solution, and the numbers and impacts are piling up.
“The leak’s duration has surpassed the 87 days of BP’s Deepwater Horizon oil spill in 2010 in the Gulf of Mexico. The leak from a well at an underground storage facility owned and operated by Southern California Gas Co. was discovered Oct. 23. It is the latest in a series of environmental disasters in recent years caused by the oil and gas industry, including oil spills in Michigan, Montana, and Arkansas and a 2010 gas pipeline explosion in California.”
http://insideclimatenews.org/print/42258
GregT on Wed, 3rd Feb 2016 2:29 pm
(Donations graciously accepted)
Oops sorry, we meant (investments graciously accepted)
Bit of a slip there, pay no attention.
rockman on Wed, 3rd Feb 2016 3:25 pm
I’m not sure how he constructed his plots. Also it’s not clear to me that he understand the decline rate of individual wells vs decline rate of a trend.
I find the EIA data to be easily understood and you can predict the developing trends as you like:
https://www.eia.gov/petroleum/drilling/pdf/marcellus.pdf
coffeeguyzz on Wed, 3rd Feb 2016 6:37 pm
Mr. Rockman
It’s beyond puzzling to me how these so-called analysts arrive st their conclusions.
In the past few months, Stone and Seneca combined are shutting in a quarter billion cubic feet/day production from currently producing wells.
An article in late October from Bloomberg estimated the shut in amount at about one bcfd across the entire Basin.
The pricing at the Dominion South transfer point was 59 cents/mmbtu a few weeks back.
There is such a withholding of production from the Marcellus operators that any suggestion that a decline is immanent due to geology/available resource is simply not accurate.
dave thompson on Wed, 3rd Feb 2016 6:49 pm
http://climatecrocks.com/2016/02/03/repost-who-will-pay-for-abandoned-frack-wells/
Nony on Wed, 3rd Feb 2016 9:42 pm
Author does not understand the DPR data source and its assumptions. Also is making a mountain out of a molehill from a warm winter and stuffed storage. The Marcellus is demand limited. That is stranded gas. It is mighty, mighty, mighty. There’s a reason why local prices are at a dollar or lower.
Nony on Wed, 3rd Feb 2016 9:43 pm
I remember hearing a lot of this same crap about the Marcellus turning down last summer. And then DPR amended their data and showed it hadn’t!
Dooma on Thu, 4th Feb 2016 2:01 am
I know that we are “down under” and out of the way but some readers my find some interest in this article…
Coal seam gas licences cancelled after AGL reaches buyback deal with NSW Government
Updated 6 Jul 2015, 4:58pm
Lock The Gate
Photo: Anti-CSG campaigners have been protesting against exploration in their communities for years. (ABC News: Dan Cox, file photo)
Map: Newcastle 2300
Campaigners fighting coal seam gas (CSG) activity north, south and west of Sydney are celebrating after a gas company sold three exploration licences back to the New South Wales Government.
The Petroleum Exploration Licences (PELs) were bought back from AGL and cancelled by the Government as part of its wider review of the CSG industry in NSW.
They covered 1.5 million hectares in the Hunter and Illawarra regions and west of Sydney.
AGL made the announcement in a statement to the Australian Securities Exchange.
The company said it had reviewed its upstream gas business and decided to “focus on core gas projects and divest non-core and underperforming gas assets and activities”.
It said although there was significant CSG in the Hunter Valley, land use restrictions had resulted “in this resource not being economic to develop”.
It also wrote down the value of its contentious CSG project at Gloucester, north of Newcastle, by almost $200 million.
The Government said it had now bought back 15 licences, after last year declaring it would “reset” the industry and develop a new strategy detailing where and how CSG activity could occur.
Cancelled licences
•PEL 2, covering 668,102 hectares stretching from south of Fitzroy Falls, through Western Sydney to west of Lake Macquarie
•PEL 4, covering 383,492 hectares in the Hunter around Muswellbrook, Scone and Denman
•PEL 267, covering 489,827 hectares in the Hunter, including Singleton, Broke and Maitland
Energy and Resources Minister Anthony Roberts said the PELs covered almost 2 per cent of the state.
“When I became Energy Minister, some 60 per cent of the state was covered by licences and exploration licences and applications,” Mr Roberts said.
“That is now down to 9 per cent, which is good news for communities.”
He said the Government’s strategic review of land use meant CSG activity in those areas was now unlikely, but the state was not closing the door on CSG development.
Lock the Gate Alliance spokeswoman Georgina Woods said the cancellation of the licences was a huge relief for wine-makers and others in the affected regions, who had campaigned against CSG activity for years.
“I think AGL knew that they were in for a battle that wasn’t worth it with a very tight community that was determined not to allow it to go ahead,” she said.
Greens MP Jeremy Buckingham said it was the “strongest signal we’ve had in the community that coal seam gas is over”.
“We’ve fought tooth and nail to see this toxic industry off, out of our water catchment, and today’s announcement by AGL is the writing on the wall for coal seam gas,” he said.
Mr Buckingham said he hoped AGL went further and cancelled all of its gas plans in the Hunter Valley.
“Now it’s up to them to abandon the projects in Gloucester that risk that community’s wellbeing.”
Jess Moore from the 6,000-strong protest group Stop CSG Illawarra, said there was no room for complacency and has repeated her call for a royal commission into the industry.
”Sadly, it’s not the end and I think it’s really important that people know it’s not the end because we could rest right now and not worry about it, but then there is nothing to stop that new licence being introduced in our region in the drinking water catchment,” she said.
“So the campaign continues.”
Go Speed Racer on Thu, 4th Feb 2016 2:54 am
Remember how the Republicans would say ‘hey we want clean water too’. They were often accused of wanting to poison air and water, just to profiteer. The repub’s didn’t like the accusation.
But then came fracking… and the repubs really DO want to just poison the water supply. They will make enough money to move to wherever there is still some clean water. All the formerly middle class, that are broke can stay on their homestead, drink poison, and die of cancer.
Apneaman on Thu, 4th Feb 2016 3:32 am
Speed Racer, it don’t matter where you live when the food you buy is poisoned a hundred different ways. They don’t want you to know anything about your food – just keep shopping.
Farms Using Oilfield Wastewater Under Review for Food Safety
http://ww2.kqed.org/science/2016/01/13/farms-using-oilfield-wastewater-under-review-for-food-safety/
No More Exposés in North Carolina
http://www.nytimes.com/2016/02/01/opinion/no-more-exposes-in-north-carolina.html?_r=0
Go Speed Racer on Thu, 4th Feb 2016 6:16 am
best bet is ‘certified organic’. run like hell from Monsanto crap. but you might buy something organic, that was irrigated with benzene solution, thanks to oilfield waste.
rockman on Thu, 4th Feb 2016 6:20 am
There are many Dems who are big proponents of frac’ng. Consider the position of the NY politicians: they are big cheerleaders for expanding pipelines from PA to NY to haul Marcellus production to them. Of course NY did ban frac’ng in the state but they have no problem doing whatever they can to facilitate that pipeline expansion. They are anti-frac’ng…they are pro-NIMBY. LOL
Davy on Thu, 4th Feb 2016 8:15 am
Good news that surely will not last going into a recession with the likelihood of demand destruction. I see new constructions being suppressed by excess supply form lower demand levels. Recessions do these things and it is unlikely alternative energy will grow in this environment.
“A Renewables Revolution Is Toppling the Dominance of Fossil Fuels in U.S. Power”
http://www.bloomberg.com/news/articles/2016-02-04/renewables-top-fossil-fuels-as-biggest-source-of-new-u-s-power
“Renewable energy was the biggest source of new power added to U.S. electrical grids last year as falling prices and government incentives made wind and solar increasingly viable alternatives to fossil fuels.”
“Developers installed 16 gigawatts of clean energy in 2015, or 68 percent of all new capacity, Bloomberg New Energy Finance said in its Sustainable Energy in America Factbook released Thursday. That was the second straight year that clean power eclipsed fossil fuels.”
“The biggest growth came from wind farms, with 8.5 gigawatts of new turbines installed as developers sought to take advantage of a federal tax credit that was due to expire at the end of 2016; Congress extended it in December.”
“Power from natural gas-fired plants accounted for 25 percent of capacity added to grids last year. Nearly one third of all electricity in the U.S. is now generated by gas, putting it nearly on par with coal.”
“A record number of coal plants were shuttered in 2015, totaling 11 gigawatts of capacity. Natural gas, meanwhile, continues to surge.”
“It looks good for gas to be a larger share of electricity generation than coal in 2016,” she said.”
JuanP on Thu, 4th Feb 2016 8:41 am
GSR, USDA certified organic, non GMO, food is also grown using fracking water. I researched it. Look up the USDA’s organic food guidelines and articles on the subject for more details.
The healthiest food you can eat is the one you grow yourself, if you do it properly. I grow nutrient dense organic food you can’t buy at any market. It is as plastic, synthetic products, and pollution free as it is possible to grow it. I use a Brix meter to measure the degrees Brix of my food and it systematically gives a higher reading to the food I grow over store bought food. Eat store bought food at your own peril, even certified organic. Most organic food is grown using plastic mulch, polluted water, and whatnot.
JuanP on Thu, 4th Feb 2016 8:51 am
Brix refractometer, http://www.amazon.com/Refractometer-Automatic-Temperature-Compensation-0-32/dp/B003H7ILCW
frankthetank on Thu, 4th Feb 2016 3:27 pm
Coal will make a comeback. Natural gas won’t last forever. Once the price skyrockets people will be heating with burn barrels in the living room stuff full of smoldering garbage.