
The IEA Oil Market Report, full issue, is now available to the public. Some interesting observations:
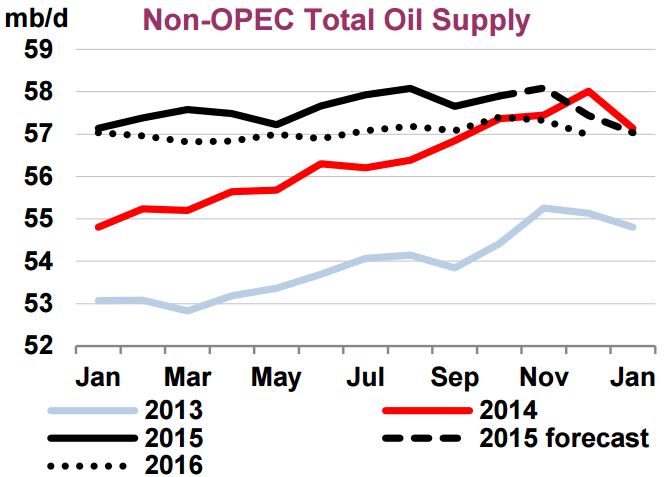
Non-OPEC oil supplies are nevertheless seen sharply lower in December. Overall supplies are estimated to have slipped by more than 0.6 mb/d from the month prior, to 57.4 mb/d. A seasonal decline in biofuel production, largely due to the Brazilian sugar cane harvest, of nearly 0.4 mb/d was the largest contributor to December’s drop. Production in Vietnam, Kazakhstan, Azerbaijan and the US was also seen easing from both November’s level and compared with a year earlier. Persistently low production in Mexico and Yemen were other contributors to the year-on-year decline.
As such, total non-OPEC liquids output slipped below the year earlier level for the first time since September 2012. A production surge in December 2014 inflates the annual decline rate, but the drop is nevertheless significant should these estimates be confirmed by firm data. Already in November, growth in non-OPEC supply had slipped to 640 kb/d, from as much as 2.9 mb/d at the end of 2014, and 2.4 mb/d for 2014 as a whole. For 2015, supplies look likely to post an increase of 1.4 mb/d for the year, before contracting by nearly 0.6 mb/d in 2016. A prolonged period of oil at sub-$30/bbl puts additional volumes at risk of shut in as realised prices fall close to operating costs for some producers.
The IEA has every month of 2016 Non-OPEC production below the year over year 2015 production.
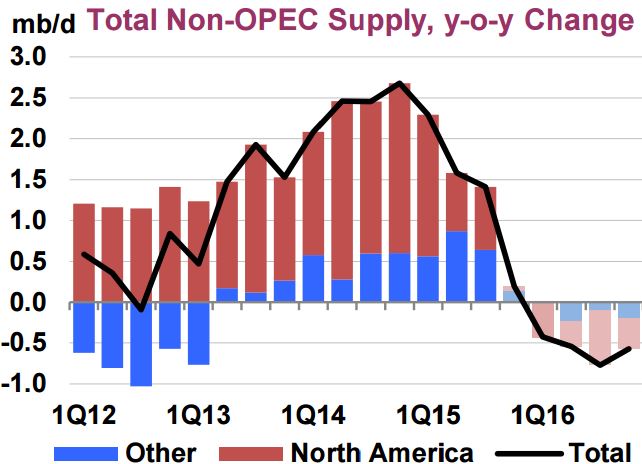
For the past four years, North America has carried the load as far as the increase in Non-OPEC production is concerned. Now the IEA believes North America will suffer the lions share of the decline in 2016.
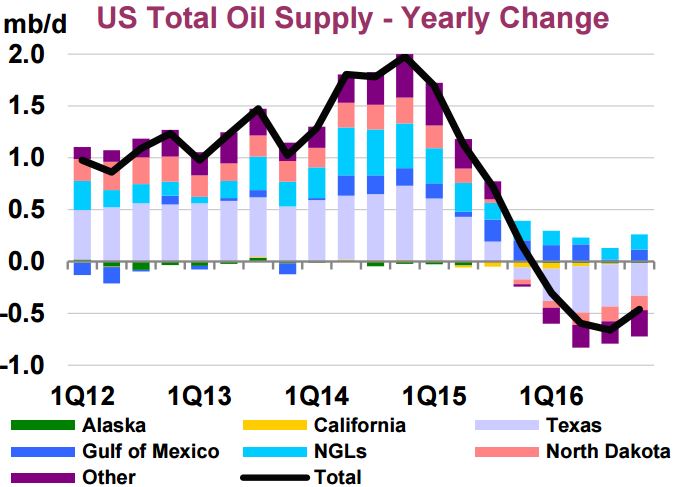
The IEA says US Gulf of Mexico and NGLs will show an increase in 2016 but every other location will show a decline with Texas showing the largest decline.
The IEA says Non-OPEC production was up 1.3 million bpd in 2015 but will be down .7 million bpd in 2016. Below are their numbers. They do not include biofuels or process gain.
2014 51.8
2015 53.1
2016 52.4
The IEA has Non-OPEC liquids in December 2015 down about 650,000 bpd compared to December 2014.
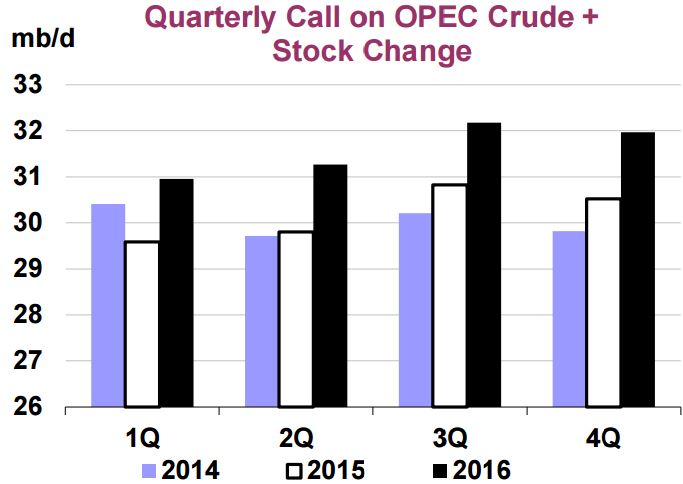
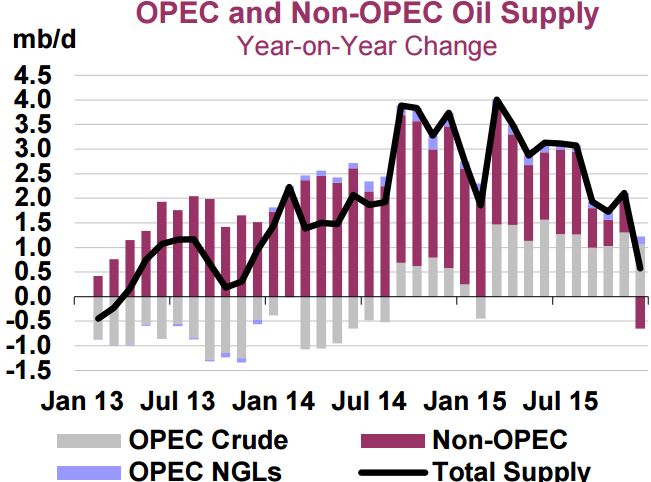
But if the IEA expects Non-OPEC production to be down in 2016, how will world oil production be able to meet the ever rising demand? Simple, just pick up the phone and call OPEC. They will supply the needed barrels.
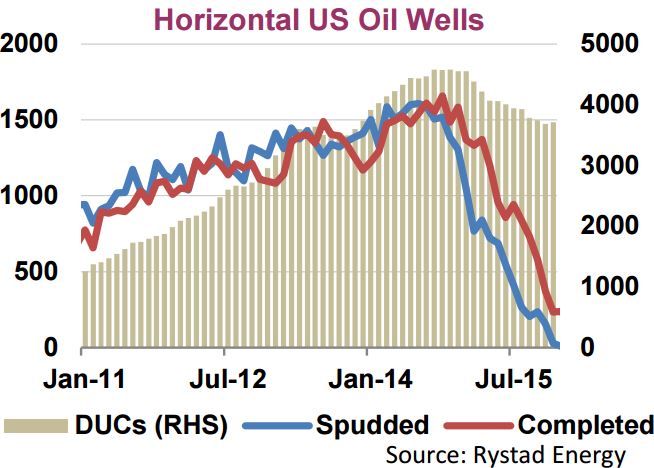
Data from Rystad Energy show the number of completed wells have by far outpaced the number of wells spudded (drilled) since 4Q14. Indeed, the number of well completions per month continued to increase several months after the rig count started to drop off, peaking at more than 1,600 wells in December 2014. The number of completions are still outpacing the number of new wells drilled, and as a result, the number of uncompleted wells, or the frack-log, has been cut down from its peak of around 4,600 wells hit at the end of 2014 to around 3,700 wells currently.
Make of the above chart what you will. I do not understand the spuds going to zero. Spuds are, quite obviously, not at zero. But then it’s not my chart.
And here are a few charts of my own. I thought it would be interesting to make some comparisons between price, rig count and production. In all charts below the right axis is always color coded with the chart data. All data is through December 2015 unless otherwise noted.
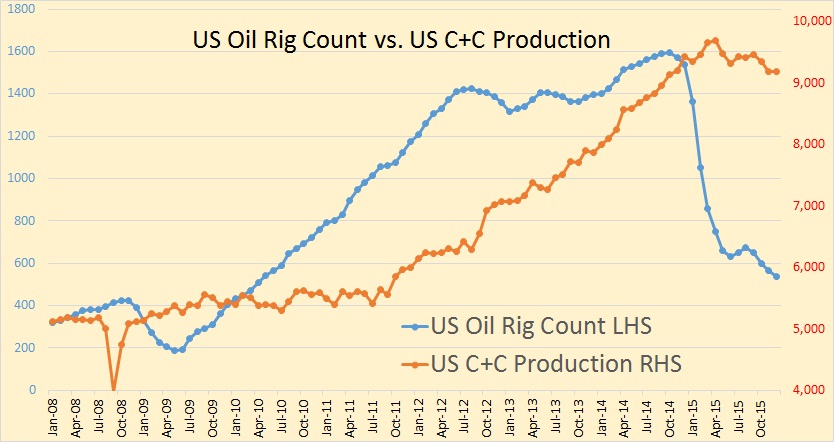
The above rig count is just the oil rig count, not the total rig count. There is obviously a delay between rig count and production. Just how many months that delay is, is not completely clear.
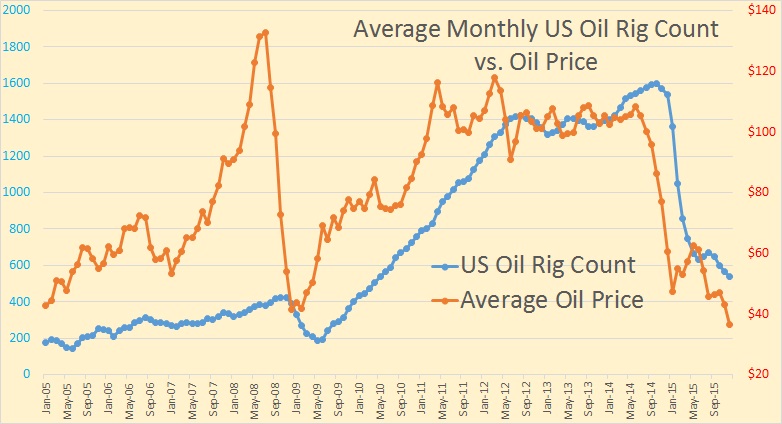
All price data is from Index Mundi and is the average of three spot prices; Dated Brent, West Texas Intermediate, and the Dubai Fateh, in US Dollars per Barrel. Quite obviously the rig count follows the price with a delay of from one year to as little as three or four months.
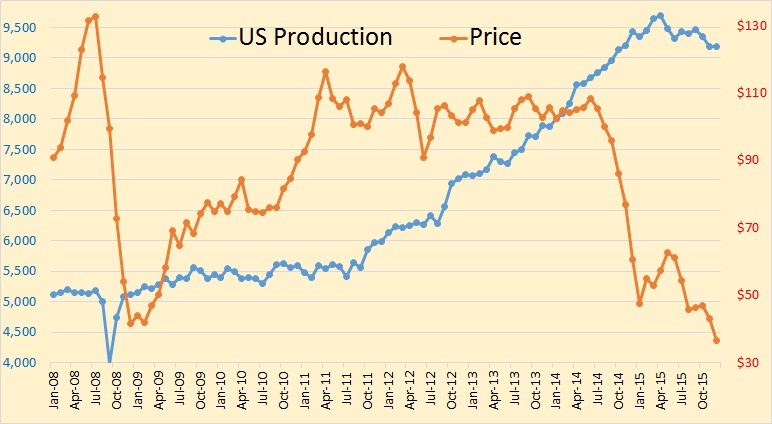
And production follows price, somewhat, with a delay that is hard to calculate.
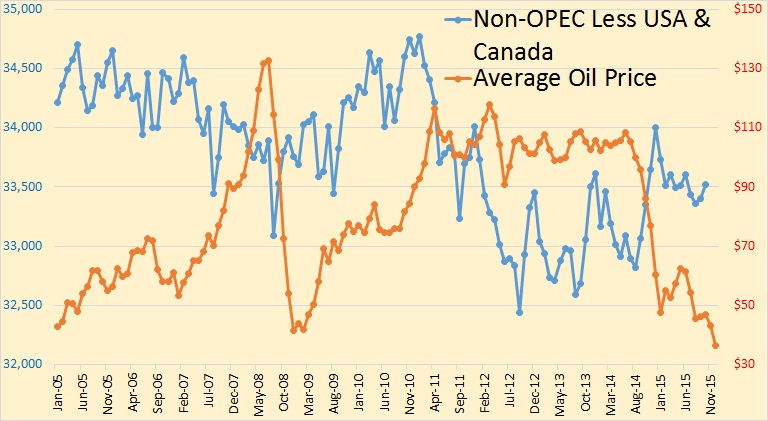
Well, production has followed price in the USA and Canada. But elsewhere everyone just seems to be producing flat out regardless of the price. Just as the price was peaking in early 2011, Non-OPEC production, less USA and Canada, began to decline. Production in this chart is only through October.
The recent surge in world production that was brought about by high prices was a USA and Canadian phenomenon only.
Boat on Thu, 4th Feb 2016 11:51 am
“The recent surge in world production that was brought about by high prices was a USA and Canadian phenomenon only”.
I wonder if he knows where Iraq is on the map.
GregT on Thu, 4th Feb 2016 12:17 pm
“I wonder if he knows where Iraq is on the map.”
I wonder if the recent surge in Iraqi oil production was brought about by high prices?
twocats on Thu, 4th Feb 2016 12:40 pm
insert “whomp whomp” meme picture of choice
twocats on Thu, 4th Feb 2016 1:28 pm
I don’t know about you guys, but these drops seem more like plateaus. If this prediction is true (stop laughing!) then will demand (assuming 1.3% increase?) catch up to supply in 2016?
Truth Has A Liberal Bias on Thu, 4th Feb 2016 2:13 pm
It appears to me that Iraqi production surged after prices collapsed.
http://peakoilbarrel.com/opec-crude-oil-production-charts/
shortonoil on Thu, 4th Feb 2016 2:27 pm
Some of this data looks very anomalous. For instance, if one looks at the US rig count vs Us C+C production between June ’09 and Sept ’11, rig count increased by 800 or 500%. During that same period US C+C production stayed flat. What were these guys doing, playing poker for 26 months? From spud to IP was no more than 8 months even back in the dark ages (2009) of shale production. Assuming 4 wells per year per rig that would have been about 1500 new wells. The decline rate of conventional US wells was probably about 5% or 250,000 b/d per year. Without some kind of explanation it is hard to take this data seriously.
Nony on Thu, 4th Feb 2016 11:55 pm
Check out all my constant commenting and trolling on this blog by Dennis. I’m just full of great ideas. I should write my own blog but I’m too busy sucking cock for wooden nickels.
http://oilpeakclimate.blogspot.ca/2015/07/oil-shock-models-with-different.html?m=1
Nony on Thu, 4th Feb 2016 11:55 pm
Dick I’m the greatest troll ever
twocats on Fri, 5th Feb 2016 12:57 am
for you nons we’ll put it on your tombstone after you commit suicide.
shortonoil on Fri, 5th Feb 2016 7:38 am
Now that the troll has come out of the closet to change the direction of the conversation again, does anyone have an explanation for the the point brought out in the comment above. There should have been a considerable increase in production, at least, between February ’10, and Sept ’11 of about 225,000 b/d. Where did the oil go?
farmlad on Fri, 5th Feb 2016 8:09 am
Short what’s up? I thought you were a numbers guy. I dare you to post like that over on Ron’s blog.
farmlad on Fri, 5th Feb 2016 8:11 am
Short I’m refering to your Feb 4 2:27 pm post
shortonoil on Fri, 5th Feb 2016 8:57 am
“Short what’s up? I thought you were a numbers guy. I dare you to post like that over on Ron’s blog.”
Why would I post it at Ron’s site?? Are you suggesting that Ron is responsible for the data? I seriously doubt that! Quit bullshitting us; where did the oil go?
farmlad on Fri, 5th Feb 2016 9:51 am
It seems we only have estimates on DUC’s or the fracklog, and that graph gives us another insight into what those numbers might be.
You say “From spud to IP was no more than 8 months even back in the dark ages (2009) of shale production. Assuming 4 wells per year per rig that would have been about 1500 new wells”. How can you be so sure? From Jan 09 til Jan 2010 the rig cont had gone down, and it could be that the completions never slowed down. So when the rigs went back to drilling the completions could have been done at a same rate that kept the production flat till about Jan 2012.
shortonoil on Fri, 5th Feb 2016 11:02 am
“It seems we only have estimates on DUC’s or the fracklog, and that graph gives us another insight into what those numbers might be.”
So what you are saying is that there were 800 rigs running for over two years that didn’t produce any oil! OH sure – I buy that!!! These outfits spent between $3.5 to $8.5 million per well, and didn’t have schedules to have them completed? Is that the kind of logic that develops when you hang around Ron’s site?
“From Jan 09 til Jan 2010 the rig cont had gone down,”
Who said anything about January 09, I said June 09. Why don’t you back date it again to Jan 1953. That should give you some even better numbers. Anyway, between your completely irrelevant Jan ’09 to Jan ’10 rig count looks like it increased by about 50. From 350 to 400.
Now that we have concluded the discussion about how many angles can dance on the head of a pin, why was there an increase of 800 rigs between June ’09 and Sept ’11 with no subsequent increase in production. That stretches the credulity of even the most dimwitted proponent of this data series.
farmlad on Fri, 5th Feb 2016 1:12 pm
Short sorry I took it you were taking a jab at Ron for picking the wrong data or something,in your first post.
Most of the commenters able to constructively discuss your question are gone and have left it all to the trolls.
Duc’s numbers was just something that I thought might be a possibility, but I realize now that it can not explain it all.
Main reason I check in once in a while is to see what you are posting, thanks.
shortonoil on Fri, 5th Feb 2016 1:31 pm
No problem.
The Edge of Reason on Fri, 5th Feb 2016 9:04 pm
“Most of the commenters able to constructively discuss your question are gone and have left it all to the trolls.”
You got that right! This site has become pretty boring. The articles are of mostly poor quality and the commenters are dull minded.