Peak Oil is You

Donate Bitcoins ;-) or Paypal :-)
Page added on July 11, 2015
The EIA’s Short-Term Guessing Game + Bakken Data

The Bakken and North Dakota production data fir May is in.
Bakken production was up 33,352 bpd and North Dakota production was up 32,114 bpd. This is quite a shocker. I had not expected production to be up this much. Bakken barrels per day, in May, stood at 1,142,034 and all North Dakota barrels per day was at 1,201,159.
| Wells Producing | |||
| Bakken | All N.D. | Non Bakken | |
| Apr-15 | 9,527 | 12,123 | 2,596 |
| May-15 | 9,704 | 12,264 | 2,560 |
| Change | 177 | 141 | -36 |
From the Director’s Cut:
Apr Sweet Crude Price = $38.33/barrel
May Sweet Crude Price = $44.70/barrel
Jun Sweet Crude Price = $47.73/barrel
Today’s Sweet Crude Price1 = $40.75/barrel (all-time high was $136.29 7/3/2008)
Apr rig count 91
May rig count 83
Jun rig count 78
Today’s rig count is 73 (lowest since November 2009 when it was 63)(all-time high was 218 on 5/29/2012)
The drilling rig count dropped 8 from April to May, 5 more from May to June, and has since fallen 5 more from June to today. Operators continue to experiment with running 1 to 2 fewer rigs than their planned 2015 minimum to see if drill times and efficiencies will continue to improve. This has resulted in a current active drilling rig count that remains 5 to 8 rigs below what was operators indicated would be their 2015 average if oil price remained below $65/barrel. The number of well completions rose slightly from 102(final) in April to 114(preliminary) in May but initial production rates are increasing 10-20% per month as drilling and completions focus more and more on the best portion of the core Bakken and Threeforks area.
Renewed oil price weakness anticipated to last into next year is by far the main reason for the continued slow-down. There was one significant precipitation event in the Williston and Dickinson areas and a separate one in the Minot area, 7 days with wind speeds in excess of 35 mph (too high for completion work), and no days with temperatures below -10F.
Over 98% of drilling now targets the Bakken and Three Forks formations.
At the end of May there were an estimated 925 wells2 waiting on completion services, the same as at the end of April. To maintain production near 1.2 million barrels per day, 110-120 completions must be made per month.
The EIA’s Short-Term Energy Outlook came out a few days ago. That is where they try to guess the future production and price for oil, for the USA as well as the world. As of late they seem to be getting a little timid with their predictions. They are saying not much growth is happening until the fourth quarter of 2016, and only a slight bump then.
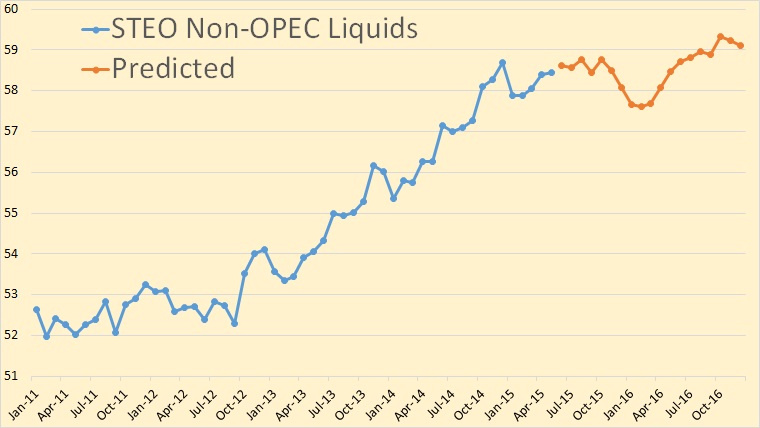
This chart is Non-OPEC Total Liquids in million barrels per day. Production of N.O Liquids surged upwards from September of 2012 until December 2014, gaining 6.38 million barrels per day in those 27 months. That’s an average increase of 236,000 barrels per day per month. But then in January 2015 there was a drop of 800,000 bpd.
Non-OPEC total liquids still have not reached that December high again but the EIA thinks they will by August. I have my doubts. I also think they have their April and May liquids production estimates a little too high here. I have their predictions here starting in June though the EIA starts their projection in July. But there is no way that June production is anything but a guess here, and a bad guess at that.
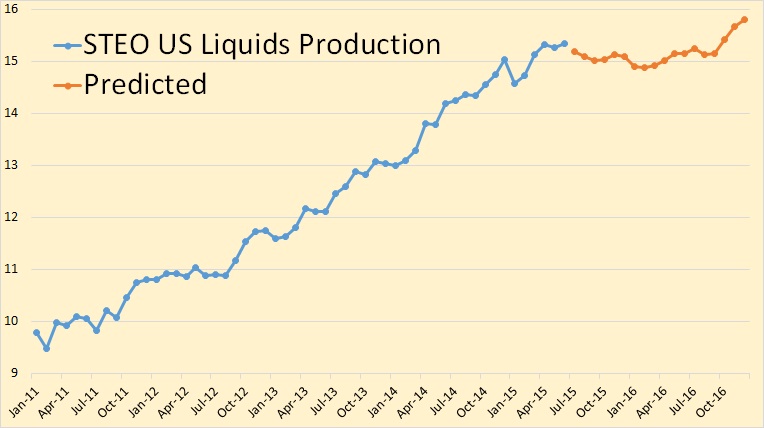
For four and one half years, US Total Liquids increased by an average of over 100,000 barrels per day per month. Now the EIA says US Liquids have reached a plateau where they will remain through September of 2016. Then for some unknown reason the US will resume it upward surge.
Notice the huge decline of 460,000 bpd in January 2015. But then there was an increase of 160,000 bpd in February, 390,000 bpd in March and 190,000 bpd in April. That’s an increase of 740,000 barrels per day over three months when the US rig count was falling dramatically. I look for those numbers to be revised in the next couple of months.
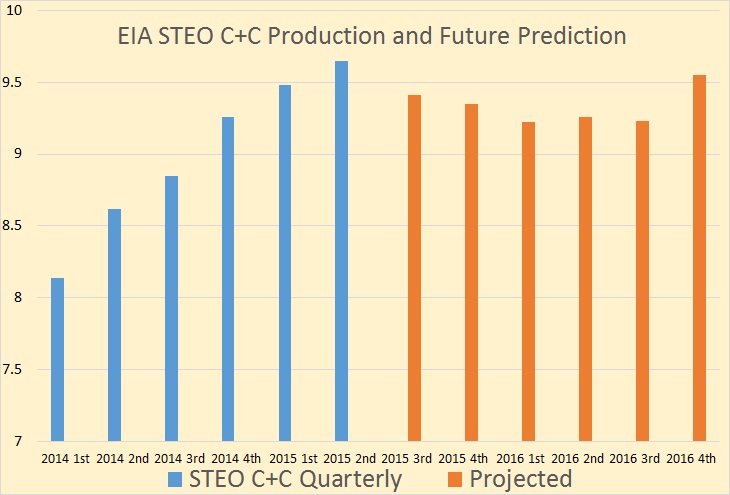
The EIA STEO has Quarterly US C+C production climbing steadily right through the second quarter of 2015. But then they have C+C production falling through the first quarter of 2016 before leveling out and then climbing again in the fourth quarter of 2016.
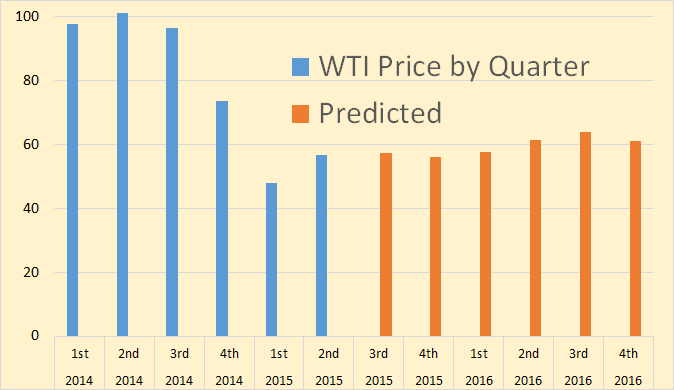
The EIA expects prices to stay low through 2016. In the fourth quarter of 2016 they have production increasing but prices falling. There seems to be a contradiction there somewhere.
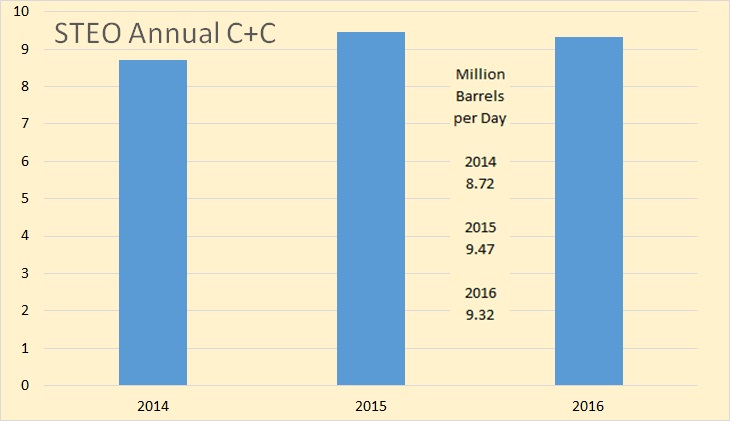
The EIA has US C+C peaking in 2015. Of course I am sure they expect the increase to continue in 2017 and possibly taking out the 1970 high either in 2017 or soon thereafter. I believe that all depends on the price of oil. If prices stay low I think shale production will continue to collapse.
China Peak Oil: 2015 Is the Year
Intense focus on the North American shale boom, Saudi Arabia, and ISIS obscures an important emerging energy trend: China’s oil production is peaking. This has profound implications for the world oil market, because China is not just a massive importer of crude; it is also among the world’s five largest oil producers, trailing only the U.S., Russia, and Saudi Arabia, and virtually neck-in-neck with Canada.
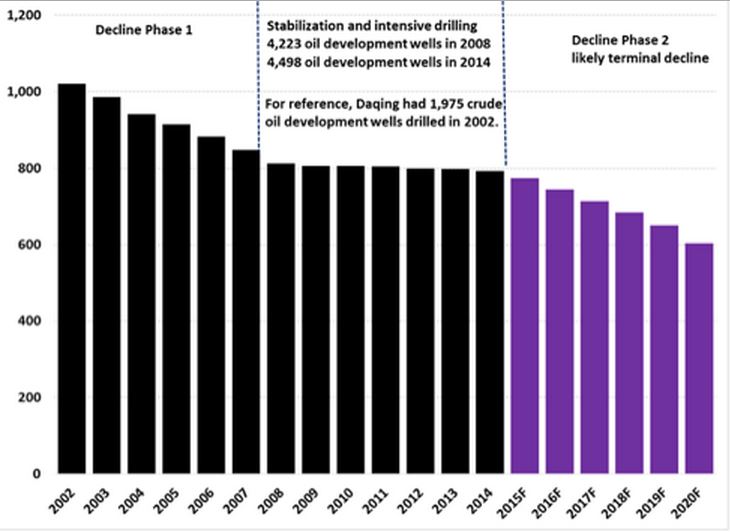
Daqing’s oil production has declined relentlessly, despite PetroChina’s significant increase in drilling activity in the field during recent years. This suggests a significant risk that production could fall faster than planned. For reference, PetroChina drilled 1,975 development wells in 2002 when oil production averaged 1.079 million barrels per day, but was forced to boost this to 4,498 development wells in 2014, when oil output at Daqing averaged 792,000 barrels per day. In short, the number of development wells drilled increased by nearly 250 percent while oil production fell by roughly 27 percent.
Daqing is the perfect example of what infill drilling can do, and what it can’t do. Infill drilling slowed the decline rate of Daqing but increased the depletion rate. I believe if the infill drilling drops off to what it was before the program began, then production will drop a lot faster than they show in this chart.
Changqing, China’s second largest oil field peaked in 2014.
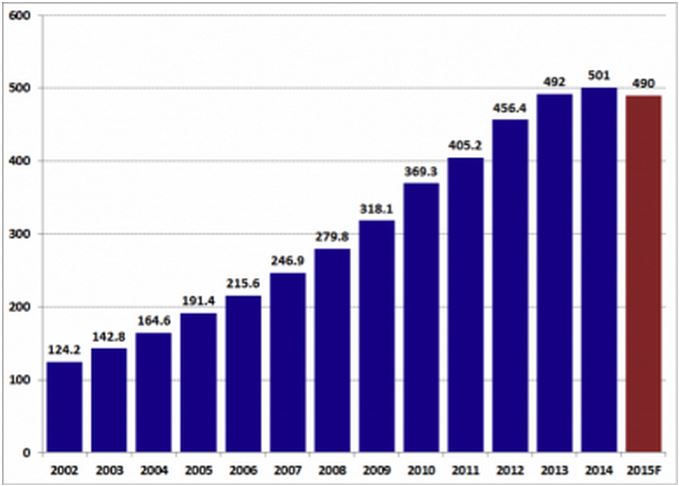
Despite some recent announcements of additional tight oil discoveries, Changqing’s slowing production growth rate over the past three or four years contrasts sharply with the hyperbolic production growth seen during the booms in world-class tight oil plays like the Bakken and Eagle Ford shales in the U.S. This difference is critically important because to offset production declines and propel significant net growth in a mature oil province like China or the U.S. requires multiple massively robust unconventional fields.
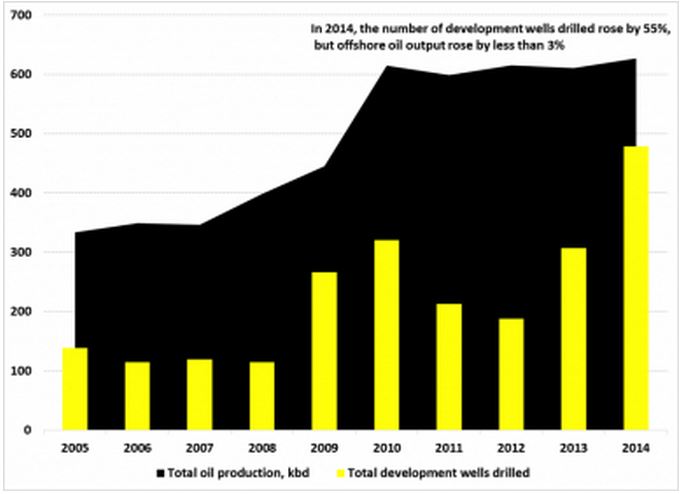
China offshore production will not save the day. A 55% increase in development wells resulted in a 3% increase in production.
China and Russia, two of the world’s five largest crude oil producers peaks in 2015. The US, the world’s third largest producer also peaks in 2015, at least temporarily. And it is very likely that Saudi is at maximum production also. 2015 will be the year of peak oil.
Shale drillers’ safety net is vanishing
The insurance protecting shale drillers against plummeting prices has become so crucial that for one company, SandRidge Energy Inc., payments from the hedges accounted for a stunning 64 percent of first-quarter revenue.
Now the safety net is going away.
The insurance that producers bought before the collapse in oil — much of which guaranteed minimum prices of $90 a barrel or more — is expiring. As they do, investors are left to wonder how these companies will make up the $3.7 billion the hedges earned them in the first quarter after crude sunk below $60 from a peak of $107 in mid-2014.
“A year ago, you could hedge at $85 to $90, and now it’s in the low $60s,” said Chris Lang, a senior vice president with Asset Risk Management, a hedging adviser for more than 100 exploration and production companies. “Next year it’s really going to come to a head.”
The hedges staved off an acute shortage of cash for shale companies and helped keep lenders from cutting credit lines, many of which are up for renewal in October. With drillers burdened by interest payments on $235 billion of debt, $89 billion of it high-yield, a U.S. regulator has warned banks to beware of the“emerging risk” of lending to energy companies.
14 Comments on "The EIA’s Short-Term Guessing Game + Bakken Data"
Nony on Sat, 11th Jul 2015 7:30 pm
June ND Bakken will probably be up also. After all WTI was $60 in June, just like in May. Decent chance that we just inch past the DEC14 record. (Maybe dip after that, given the JUL price drop.)
Don’t think there is that much to be astonished with. ND is basically going sideways as was predicted. Prices have helped also, well until first week of July.
Bakken is hurt by its transport differentials compared to EF and Permian, but has some spots of very nice rock (and those are the projects still being drilled). Plus it is older, so has a lower inherent decline rate. And fracklog being depleted as well as other contango trade influenced actions ending (foregone maintenance, choked well, etc.) Plus the normal recovery from winter conditions.
Market is just futzing around trying to find out the equilibrium. But it sure doesn’t look like Hamilton’s “hundred dollars to stay”, much more the inverse insight (producers won’t see 100 any time soon). Of course if he redoes his paper, he can also update the obnoxious 50 charts of US states peaking with a comment that the number one producing state, Texas, re-peaked. 😉
Jimmy on Sat, 11th Jul 2015 8:19 pm
Fuck off with your opinions nony. Go start your own blog you fucking troll. Nobody gives a fuck about your uninformed opinions. Not Art Berman, not Ron, nobody. Fucking goof!
Nony on Sun, 12th Jul 2015 9:38 am
If the mods (or most posters) want me gone, I will go.
I know that I troll some…and other times come up with good points but that are not welcome. I really believe there should be a place for everyone, including hippy farmers and doomers and all the like. It’s not like you all are sneaking into cornie sites and screwing with them.
Berman and Ron have neat blogs. It is their right to exclude me. But it is a little much to say I can’t comment on the Internet about their content. This is still America.
Don’t be so rough, man.
Northwest Resident on Sun, 12th Jul 2015 9:49 am
Stick around, Nony. But drop the sock puppets please. When you feel that surge of righteous delusional cornie anger swelling up and seeking release, take a break instead of assigning one of your sock puppets the task of trolling this forum.
Boat on Sun, 12th Jul 2015 10:03 am
Nony, some of these guys have no clue what America is or about. The idea of oil depletion isn’t going to happen soon and they don’t like anyone saying it even if the truth is very apparent. I don’t keep up with the tit for tat but your views on nat gas are much closer to what I would call reality than theirs. Your battling a herd mentality that jumps at anything that that conflicts with an immediate system crash.
Northwest Resident on Sun, 12th Jul 2015 10:11 am
Boat, oil depletion has been happening all along, only now it has reached a critical stage. From the moment oil first got extracted and burned, depletion began. But sure, you and Nony please do continue to let us know your version of the “truth” — or, what fact-based minds would more aptly consider “denial”.
Boat on Sun, 12th Jul 2015 10:21 am
yea yea the first drop of oil started the race to depletion. Fact is the numbers bear no resemblance of depletion or replacement fuel and tech. Every year that goes by we come closer to solving our future and current energy potential shortages.
marmico on Sun, 12th Jul 2015 10:33 am
The average annual real (adjusted by the CPI-U) price of a gallon of regular gasoline in the U.S. in the 38 year period between 1976 and 2014 is $2.55.
You could look it up in the EIA Real Price Viewer here.
Affordability and depletion my ass when a new vehicle can on average travel further on the 2015 price of $2.75 per gallon relative to the 38 year average of $2.55 a gallon.
Boat on Sun, 12th Jul 2015 10:46 am
Great chart. Not sure how the cost per mile is by the time you add in insurance, tolls and cost of the car etc. But it does dispel some of the talk about demand destruction due to current prices.
Nony on Sun, 12th Jul 2015 11:24 am
Thanks hippy corpsman. Marmand Plant and boat and papa smurf are different from me. I just agreed with you because it was easier to laugh aboiut a false accusation than argue with you.
rockman on Sun, 12th Jul 2015 3:11 pm
“June ND Bakken will probably be up also. After all WTI was $60 in June…”. The June Bakken production has zero relationship to the price of oil in June. As usually some wish to ignore the LAG TIME between drilling and first production. The many, if not most, of the wells coming on in 3Q 2012 were drilled based on economic considerations (and the price of oil) in late 2014. Remember the is also another lag time to consider: the time between economic evaluations that justify drilling a specific well and when the well is spudded. That can easily be several months. So even wells that were spudded in 1Q 2015 were approved in 4Q 2014…and based upon oil prices at that time. And lets not forget such economic evaluations could have remained very attractive well into 2015 for those companies that hedge much of their production. They may have still been using $85+/bbl in the economics even when prices dipped below $50/bbl.
No point in debating these FACTS today. By the end of 2015 the trend will be undeniable.
Nony on Sun, 12th Jul 2015 3:26 pm
1. I agree with you on the full cycle time. But that is not the same as saying “no relation” to price. Because producers have the option to delay projects at various stages of completion. If you read around a little more (more reading, less blowhard commenting) you would have seen this in the popular press, in analyst discussions, and at investor quarterly reports by major shale producers. And if you had read my post, you would have seen me discuss that.
2. How come you cite “lag” here (correctly btw), but also talked about Texas peaking in AUG14? :-O
Boat on Sun, 12th Jul 2015 4:27 pm
Rock, No point in debating these FACTS today. By the end of 2015 the trend will be undeniable.
I don’t debate for a second production will come down from fracking because of the drop off in wells. That is because of an oversupply of global oil. If Iran and the US do a deal the market could add another 1,5 mbpd and drop the oil price even farther causing more well drilling crews to shut down. Or we could go to war with Iran and oil is at $200 per barrel or higher id the Middle east is in flames. That has nothing to do with being a corney except proof is out there that there is plenty of oil at cheaper prices for the foreseeable future excluding wars. That my friends is and was the miracle of fracking.
Nony on Sun, 12th Jul 2015 4:31 pm
Ain’t competition grand!