Peak Oil is You

Donate Bitcoins ;-) or Paypal :-)
Page added on December 15, 2012
The Bumpy Plateau Tilts Upward

Every month I post the numbers for total oil supply, which seems to me the best way to get a sense for the issues around peak oil: how much the global oil supply is actually able to increase or decrease.
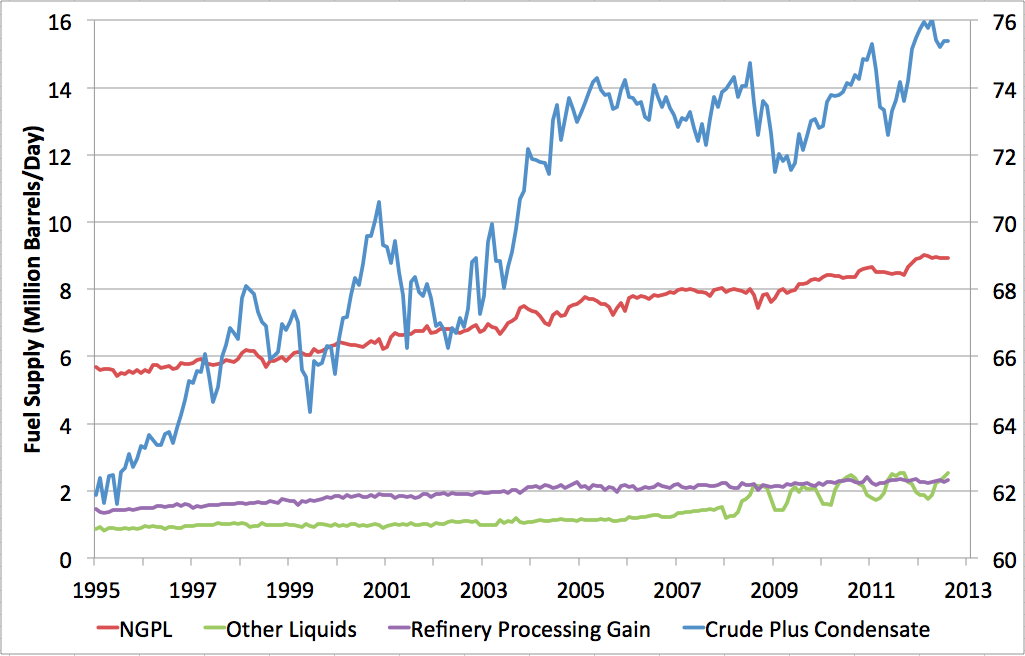
However, when you look closely, “oil” turns out to be a slippery concept with the global liquid fuel stream being made up of a variety of things, not all of which are altogether oil-like. The EIA is the agency that keeps the best track of this, so every few months I like to post some graphs based on their breakdown. The components, through August 2012, look as follows:

Here, crude and condensate (C&C: by far the largest part of the stream) are the most truly oil – hydrocarbon liquids that come out of the ground. The other components are NGLs – molecules from ethane to pentane that are condensed out of the natural gas stream and may or may not be liquid depending on circumstances. These are not exactly oil but may substitute for oil in various ways – for example, some butane is added to winter gasoline, propane competes with heating oil as a rural heating fuel, and NGLs and lighter crude fractions are substitutes to some degree as petrochemical feedstocks. So it’s not entirely unfair to consider them together with the liquid fuel stream, but nor is it entirely satisfactory.
The “other liquids” are mainly biofuels – ethanol and biodiesel that ultimately come from devoting portions of the world’s cropland to fuel production. Meanwhile, refinery gains reflect the fact that some heavier crudes expand during refining (this isn’t really an energy gain but is an artifact of our tradition of using volume units for liquid fuels).
This next graph shows the C&C on the right scale and the others on the left scale, making it easier to compare changes (a 2mbd increase will be the same size on the graph for all components):
For a long time, the C&C was essentially flat and one could truthfully argue that all the increase in total liquids was coming from NGLs and biofuels (ie that “real oil” was plateaued or peaking). However, this is no longer true: global C&C production has increased by about 2mbd since the beginning of 2005. Over eight years, this is only a 0.33% average rate of growth – an incredibly slow crawl upward. However, it seems indisputable that it has grown.
We seem to be on a bumpy plateau of global oil production, but that plateau has had a very slight upward tilt.
11 Comments on "The Bumpy Plateau Tilts Upward"
BluT Bird on Sat, 15th Dec 2012 4:13 pm
I prefer the graphs that show a sharp peak for oil production, with a steep dropoff. Could you publish more of that kind of graphic, please???
We don’t call it plateau oil.
Arthur on Sat, 15th Dec 2012 4:26 pm
Good… a plateau means sustained high prices so renewables can stay being competitive and the longer the plateau lasts, the more time we have to introduce renewables. China anounced it wants to install 40 GW solar by 2015, which is extremely ambitious, but very good news for the solar industry, which will be pushed towards a threshold where the advantages of economy of scale start to kick in with decreasing prices as a result (even as low as 30 cent/watt). And the UK is working on 30 GW of wind power. The carbon age is running out indeed, but fortunately not as fast as was previously anticipated.
Rick on Sat, 15th Dec 2012 4:29 pm
@ Arthur
I would agree.
CAM on Sat, 15th Dec 2012 5:37 pm
The plateau may well be rising, albeit ever so slightly. But where does this leave us after EROEI is factored in. Even conventional petroleum has become more expensive and energy intensive to extract.
poaecdotcom on Sat, 15th Dec 2012 5:42 pm
Yes I agree, the bumpy plateau has had a recent uptick, thanks for the analysis EW.
However, the layer of analysis that is missing here is that the cost per barrel of production has increased since 2005 both in dollar terms and energy terms.
The implication is twofold.
One, the production level is much more sensitive to oil prices and should/when a recession hit oil demand, price may fall below cost of production for many producers on the margin, killing supply. Obviously important, as it essentially places a floor on oil price, hampering economic growth.
Seconlyd, and more importantly. The EROEI (net energy) is falling. Low hanging fruit principle. And as a logical extension from the laws of thermodynamics, any society is only as complex as the available energy to it.
Whilst, production remains flat (slight uptick), the net energy to society to make any kind of transition is ALREADY on an insidious path downwards.
The URGENCY from transition is greater than this article would imply.
Go local
poaecdotcom on Sat, 15th Dec 2012 5:43 pm
;o) nice one CAM…. you EROEI ninja’d me
Plantagenet on Sat, 15th Dec 2012 5:49 pm
If oil production is still going up then the plateau isn’t a plateau—it is slow growth.
When frakking is included, when will the peak actually occur now?
blacknail on Sat, 15th Dec 2012 6:42 pm
If we are using 3mbpd to get those extra 2 mbpd then it isn’t a net gain at all, it is less available energy with more cost and pollution.
Concerned on Sat, 15th Dec 2012 11:37 pm
Refinery gains check
Ethanol check
Condensates check
This is like the employment numbers strip out discouraged workers and numbers look great except with “oil” production add in anything that make the numbers look better.
Oil price $85-$100 bbl yeah we have a second coming in energy? I think not.
Sharpie on Sun, 16th Dec 2012 1:52 am
0.33% over eight years.
That’s a very, VERY minuscule uptick in oil extraction and almost not worth making an article about.
Look at the sharp output surges from 1995-1997, 1999-2000, or 2002-2005.
We had better make the most of that 0.33%.
BillT on Sun, 16th Dec 2012 2:33 am
How do you compare oil with an energy of 100 and moonshine with an energy of 20 and call them even? Barrels of what? Cooking oil? Rubbing alcohol?
As mentioned above, the graph would be taking a nose dive if NET energy was compared from previous years until today. NET energy per person began dropping last century and is still falling. THAT is the important numbers, not government propaganda.