Peak Oil is You

Donate Bitcoins ;-) or Paypal :-)
Page added on February 21, 2016
Texas Oil Production on a Plateau

The Texas RRC Oil and Gas Production Data is out. There appeared to be no decline in December production and may have even been a slight increase.
The Texas RRC data is incomplete and only gives an indication as to whether Texas production increased or decreased. The data appears to droop because each month the the Texas Railroad Commission receives a little more data and the totals increase, little by little, month by month, until after many months the data is complete.
In my charts I post the past six months of data in order to give some indication as to whether production is increasing or decreasing. The final data is through December and the EIA data is through November.
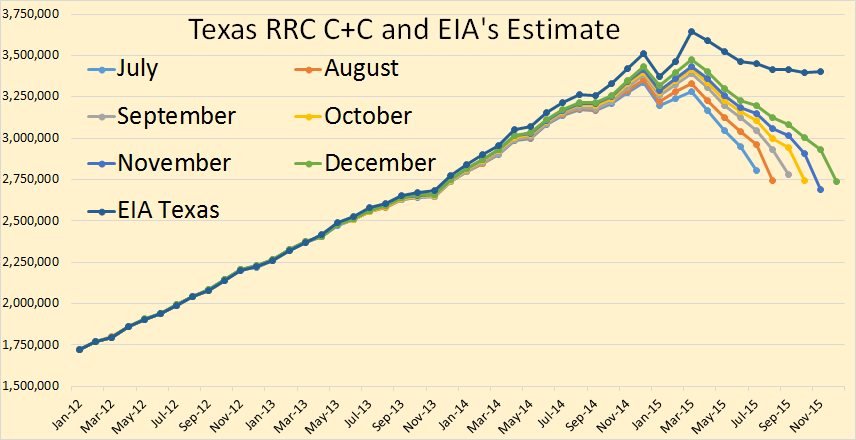
Texas crude plus condensate declined a little in November but seemed to make up that decline in December. Total Texas C+C seems to be on a flat plateau, declining in Eagle Ford but making up that decline in the Permian and the rest of Texas.
The EIA estimates the final Texas data through November. They have Texas peaking in March and down about a quarter of a million barrels per day since that point.
Dr. Dean Fantazzini, Deputy Head of the Chair of Econometrics and Mathematical Methods in Economics at the Moscow School of Economics, Moscow State University, has worked out an algorithm that predicts what the final production numbers will look like. He has C+C relatively flat the last few months and slightly above the EIA estimate.
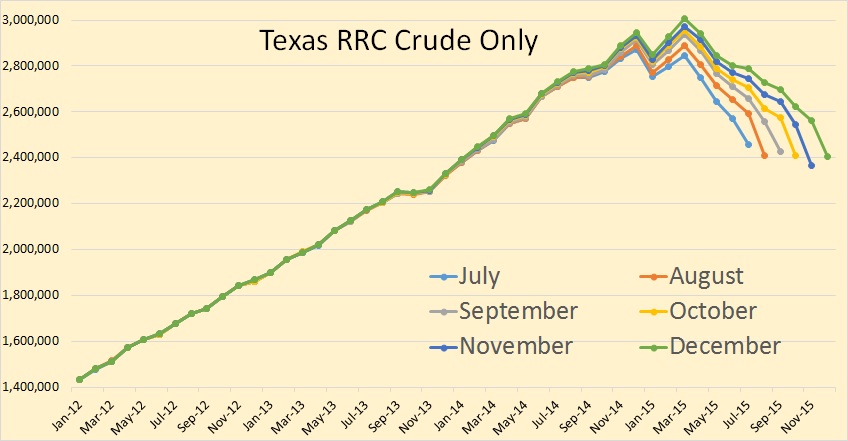
Texas crude only shows basically the same pattern as C+C.
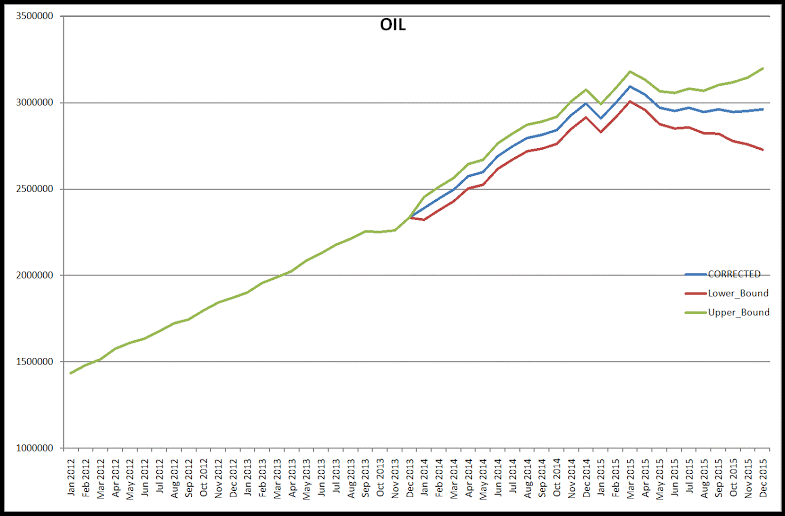
This is Dean’s estimate of what the final Texas crude only production will look like.
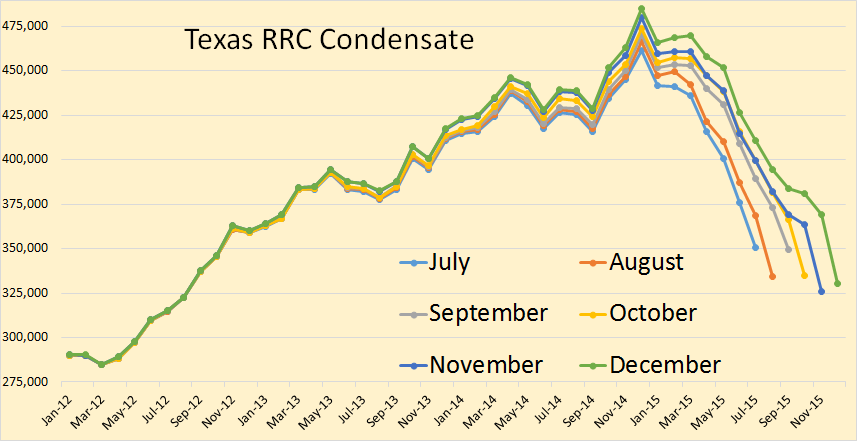
Texas condensate seems to have a slightly steeper decline than does crude only and peaked in December rather than March when crude only peaked. I use the term “peaked” to mean “peaked so far” and am not implying that it is the final peak. Only time will tell whether it is the final peak or not.
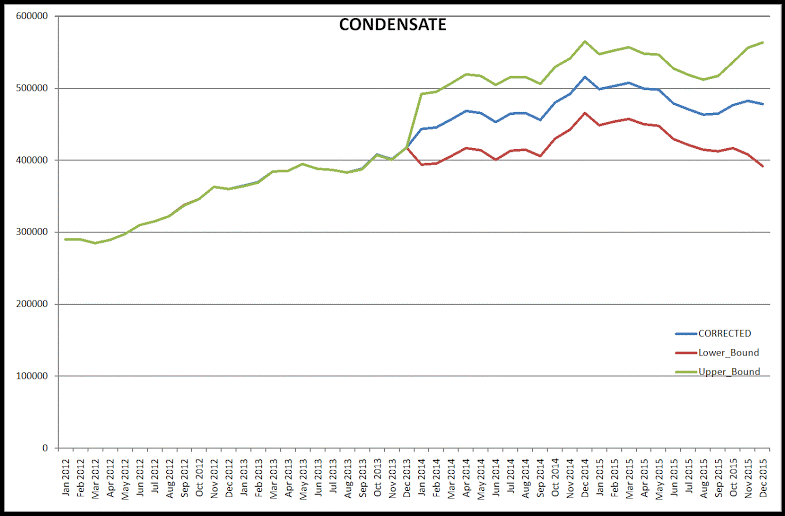
Dean’s data agrees that condensate peaked in December.
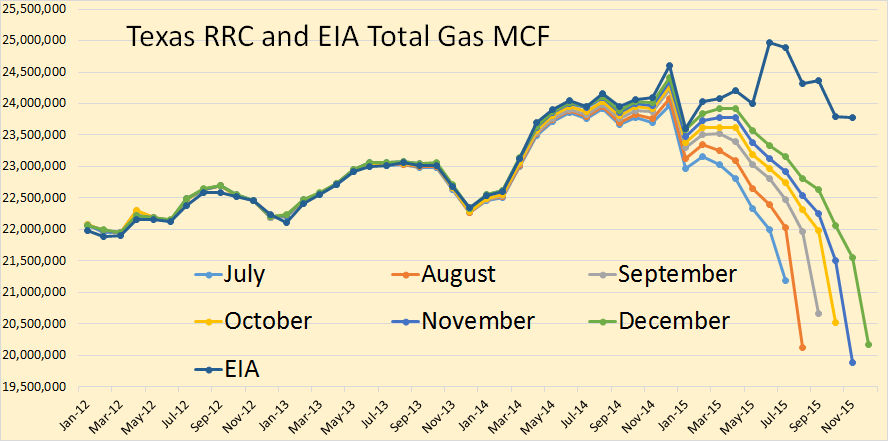
Texas total gas production, according to the EIA, peaked in June, so far, and now seems to be declining a bit faster than oil.
Dean shows Texas total gas production on a plateau with a slow decline. He has Texas gas production, in November, slightly above the EIA’s estimate.
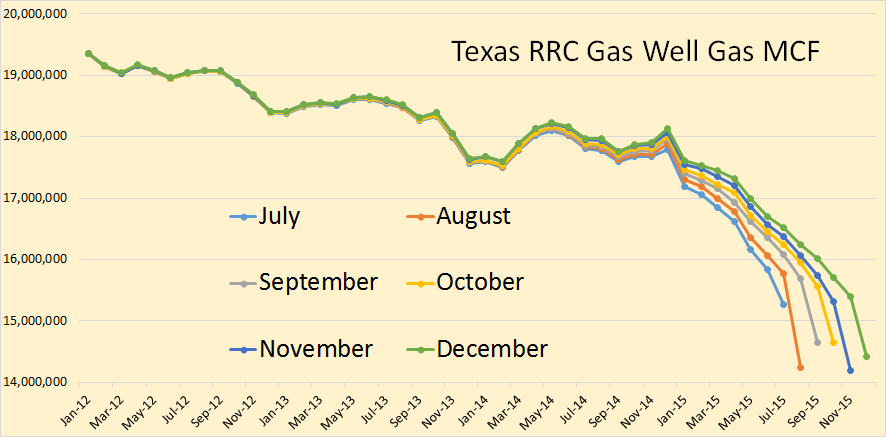
Texas gas well gas actually peaked in early 2009 and has since been in a slow but steady decline.
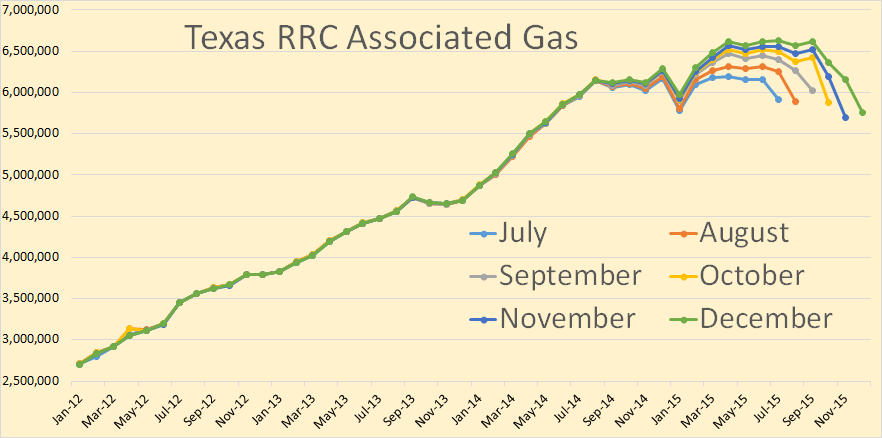
Texas gas production has been kept increasing by the increase of associated gas. The shale oil boom is largely responsible for the increase in Texas associated gas.
14 Comments on "Texas Oil Production on a Plateau"
Nony on Sun, 21st Feb 2016 5:16 pm
As usual charts are not zero based which just exaggerates the decline. If the charts were zero based the decline would not even be noticeable, unless you made the chart really really big but then it’d be so big you’d have to zoom in to look at the part at the top. The flaw in data presentation renders peak oil a hoax.
Apneaman on Sun, 21st Feb 2016 6:14 pm
5 more earthquakes rattle parts of Oklahoma Friday
http://ksn.com/2016/02/19/3-more-earthquakes-rattle-parts-of-oklahoma-friday-morning/
Harquebus on Sun, 21st Feb 2016 6:28 pm
Those that deny “peak oil” do not understand it.
onlooker on Sun, 21st Feb 2016 6:41 pm
http://ecowatch.com/2015/04/23/oklahoma-earthquakes-caused-by-fracking/
Northwest Resident on Sun, 21st Feb 2016 6:45 pm
“The flaw in data presentation renders peak oil a hoax.”
Looks like Nony is trying to stir up trouble by making an absurd point. He likes to do that.
The article is about Texas being “on a plateau, so how close does one need to zoom in on a graph to get the idea that the current data points illustrate a more or less flat line?
As if the entire complex subject of peak oil could be disproved by a single poorly interpreted graph.
Sorry, Nony. This time, not even a good try.
rockman on Sun, 21st Feb 2016 7:11 pm
NW – Good point. And another good point: regardless of how the chart is designed it doesn’t change the numbers. Start the chart in 1777 and the recent numbers don’t change. Now if you can’t read then one might be mislead if all they grasp is shapes. LOL.
onlooker on Sun, 21st Feb 2016 7:15 pm
Yep, peak oil data like global warming data has been meticulously chronicled, charted and dissected. The consequent conclusions reached by us doomers are predicated precisely on this extensive analysis. So it is a pathetic attempt by Nony to discredit Peak oil by simply looking at one graph and one state within one country. I think Nony you win this months Dunce award. haha.
Nony on Sun, 21st Feb 2016 7:49 pm
I didn’t post it. Was some Internet yipyap, copying my login.
I don’t have any big problems with this article.
twocats on Sun, 21st Feb 2016 8:53 pm
Poor nony, now that i’m rereading “nony”‘s post, its obviously not you, it just sounds enough like you that on skimming it… man that’s funny.
yeah, nothing much new here, production steady…
yoananda on Mon, 22nd Feb 2016 4:16 am
EVERYTHING in the world is going exactly like peak oil theory predicted … except for oil barrel production !
😉
Apneaman on Mon, 22nd Feb 2016 5:09 am
Yep, barrel counts that’s all that matters.
As U.S. shale sinks, pipeline fight sends woes downstream
“Within weeks, two low-profile legal disputes may determine whether an unprecedented wave of bankruptcies expected to hit U.S. oil and gas producers this year will imperil the $500 billion pipeline sector as well.
In the two court fights, U.S. energy producers are trying to use Chapter 11 bankruptcy protection to shed long-term contracts with the pipeline operators that gather and process shale gas before it is delivered to consumer markets.
The attempts to shed the contracts by Sabine Oil & Gas (SOGCQ.PK) and Quicksilver Resources (KWKAQ.PK) are viewed by executives and lawyers as a litmus test for deals worth billions of dollars annually for the so-called midstream sector.
Pipeline operators have argued the contracts are secure, but restructuring experts say that if the two producers manage to tear up or renegotiate their deals, others will follow. That could add a new element of risk for already hard-hit investors in midstream companies, which have plowed up to $30 billion a year into infrastructure to serve the U.S. fracking boom.
“It’s a hellacious problem,” said Hugh Ray, a bankruptcy lawyer with McKool Smith in Houston. “It will end with even more bankruptcies.”
more
http://www.reuters.com/article/us-usa-oil-lawsuits-idUSKCN0VV0DK
Apneaman on Mon, 22nd Feb 2016 5:13 am
HSBC Shares Plunge After Bad-Loan Charges Drive Quarterly Loss
“The result, depressed in part by the rising cost of bad loans to oil and gas companies suffering from crashing energy prices, marks a setback to Chief Executive Officer Stuart Gulliver’s efforts to bolster profitability and reverse a share slump.”
http://www.bloomberg.com/news/articles/2016-02-22/hsbc-posts-surprise-fourth-quarter-pretax-loss-of-858-million
yabut, barrel counts N stuff.
frankthetank on Mon, 22nd Feb 2016 7:44 am
Dept of Ministry states everything is fine…centuries worth of oil, gas and coal. Production is strong, growth is strong. Rations will be increased. Nothing to worry about. Grandma can continue driving to her mailbox.
rockman on Mon, 22nd Feb 2016 9:54 am
y – In reality the current high production rate and low oil price fit the PO model perfectly. If you don’t understand the POD now after what we’ve witnessed over the last 15 years I suspect you never will.