Peak Oil is You

Donate Bitcoins ;-) or Paypal :-)
Page added on January 14, 2015
Short-Term Energy Outlook 2015 and 2016

The EIA has just released their Short-Term Energy Outlook for January. They have now included their predictions for 2016. Here is what they expect for US C+C. I have made the first projected production for December 2014 though the EIA says they have production data for December. All date is in million barrels per day through December 2016.
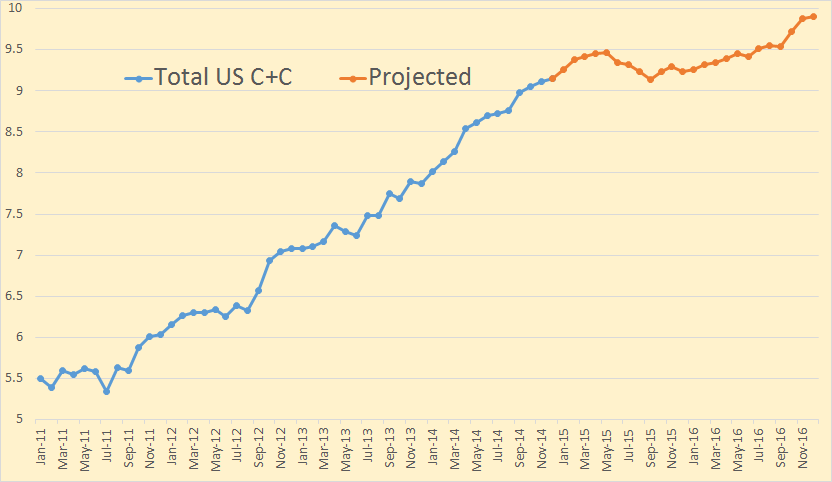
The EIA is saying that US C+C will peak at 9.47 mb/d in May 2015, drop 330,000 barrels per day by September 2015 then recovers, apparently because the price of oil goes back. Or perhaps they have another reason. They do not have US production surpassing May 2015 until July of 2016.
The EIA only gives C+C outlook numbers for domestic production. However they do project total liquids for all Non-OPEC nations. But first here is what they are predicting for US total liquids:
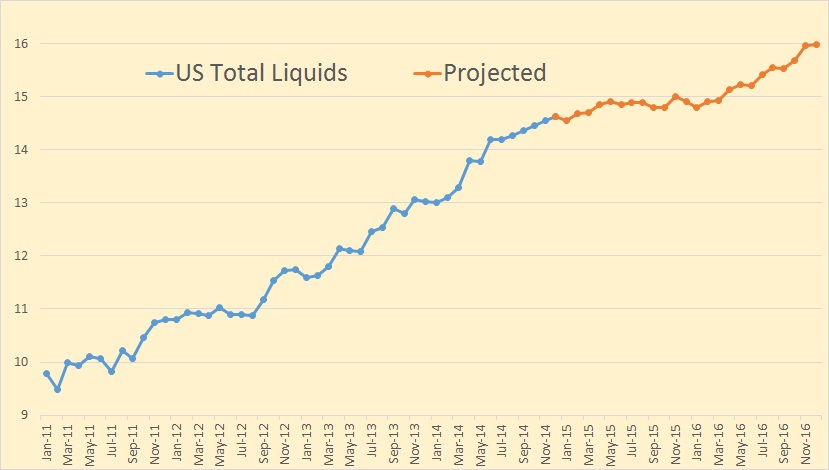
The EIA has US total liquids hitting a plateau in July 2015 then heading up again in April 2016 and increasing by 1 million barrels per day during the remainder of the year.
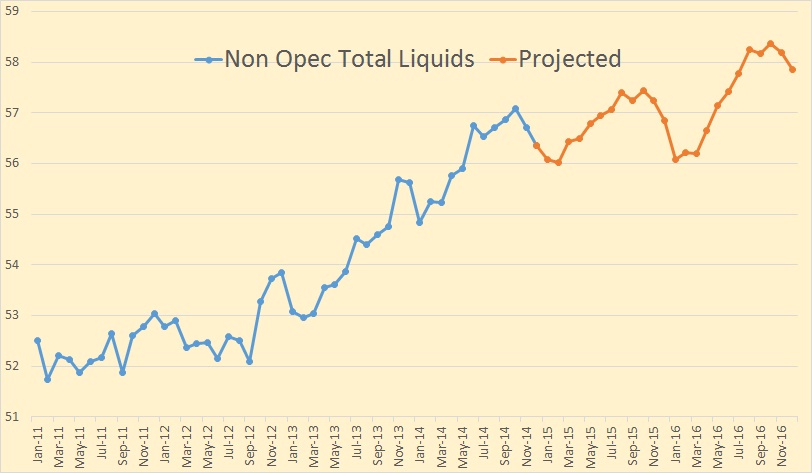
The EIA has Non-OPEC total liquids peaking in October 2015 then dropping by over one million barrels per day by February 2015 before heading up and making new highs in August and October. Then they have the pattern repeating again, bottoming out in January 2016 and increasing by 2.3 mb/d by October.
But all that up and down seasonal movement is caused by ethanol production in Brazil.
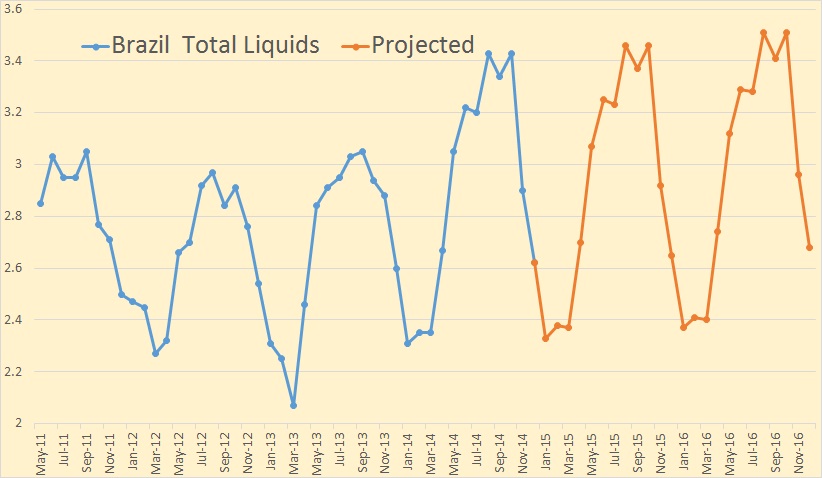
Isn’t it remarkable how Brazil liquids production looks exactly the same for three years, just inching up a few thousand barrels per day each year. But we have to take Brazil out of the picture to get a better picture of what is really happening.
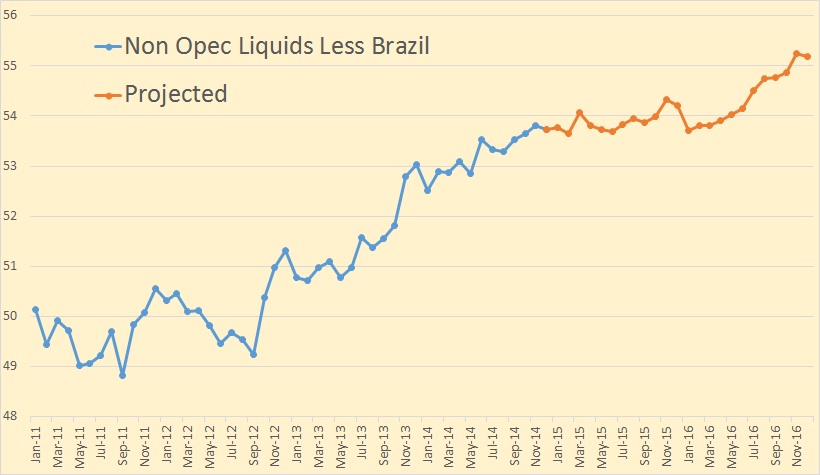
The EIA has Non-OPEC liquids, less Brazil, plateauing until January 2016 then increasing by about 1.5 mb/d during the remainder of the year.
One place where I agree with the EIA is concerning the peaking of Russia and the rest of Eurasia.
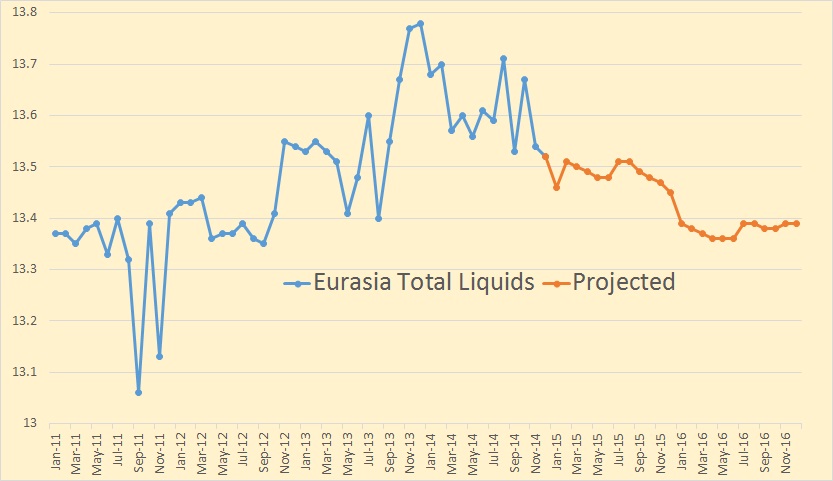
They have Eurasia down about 400,000 barrels per day by the end of 2016 from their peak in December of 2013. Apparently they don’s see Kashagan coming on line before 2017.
They have Russia declining by about 200,000 barrels per day from their peak in November 2013 to the end of 2016. Notice they have Russia spiking up in October 2014 before coming back to their normal decline pattern.
Note 1: North Dakota is scheduled to post their production numbers for November soon, perhaps later today or tomorrow. In either case I will have a post on it tomorrow if it does come out. Otherwise I will just have to wait for it.
2 Comments on "Short-Term Energy Outlook 2015 and 2016"
Plantagenet on Wed, 14th Jan 2015 3:00 pm
It’s amazing that tight shale oil production can continue to grow at these low prices
Danlxyz on Thu, 15th Jan 2015 7:00 am
Plant, apparently it cant. Look at the latest North Dakota production report. Production has been flat for the last 3 months. The number of drilled but not completed wells went up by 125 to 775.