Peak Oil is You

Donate Bitcoins ;-) or Paypal :-)
Page added on March 17, 2015
OPEC Crude plus More on EIA Estimates

The katest OPEC Monthly Oil Market Report is out with OPEC crude only production numbers for February. All data in the OPEC charts below is in thousand barrels per day and the last data point is February 2015.
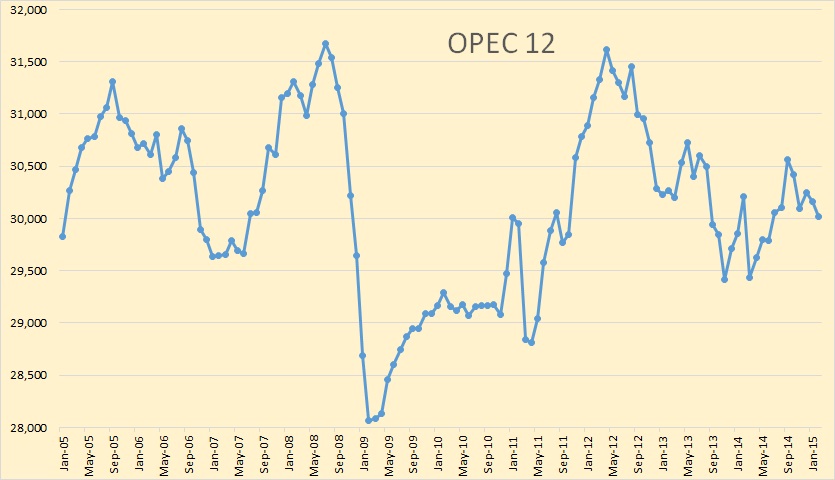
Total OPEC crude only production was down 137,600 barrels per day in February.
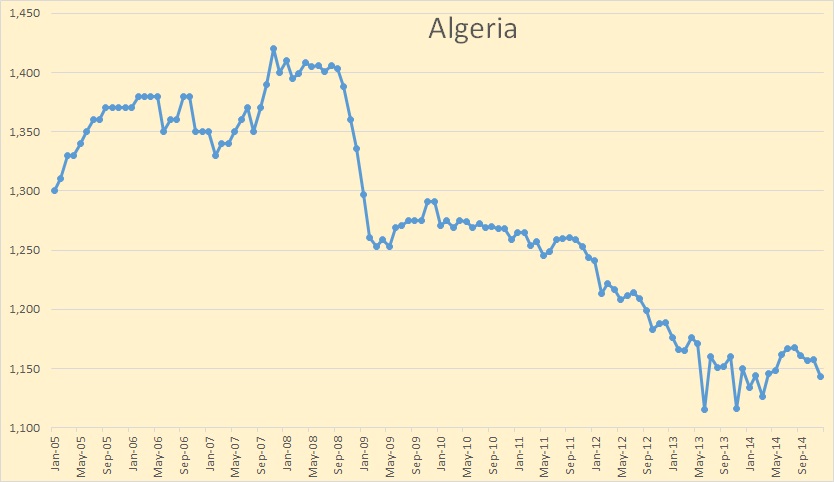
Algeria seems to have stabilized their decline.
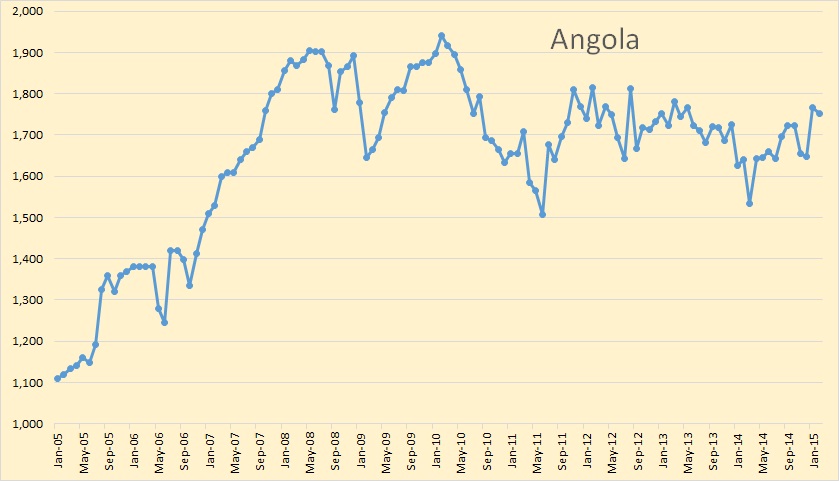
Angola is holding steady.
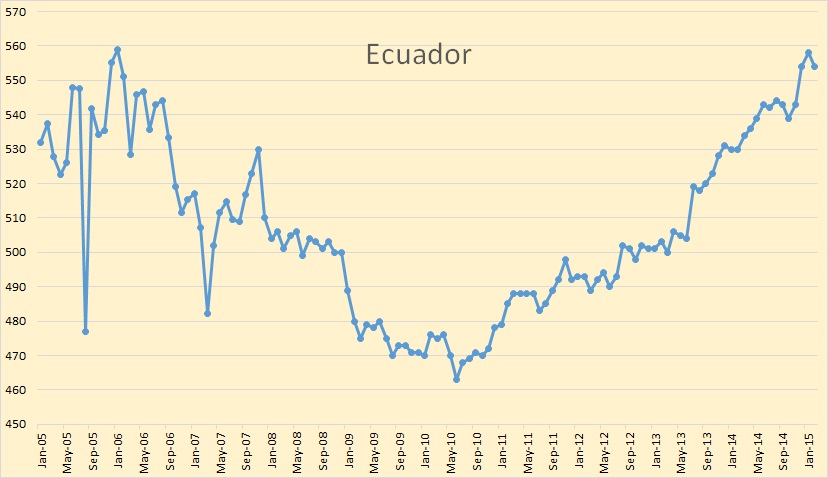
Ecuador has been slowly increasing production at a rate of about 25,000 barrels per day per year. I don’t think they can hold that for another year however.
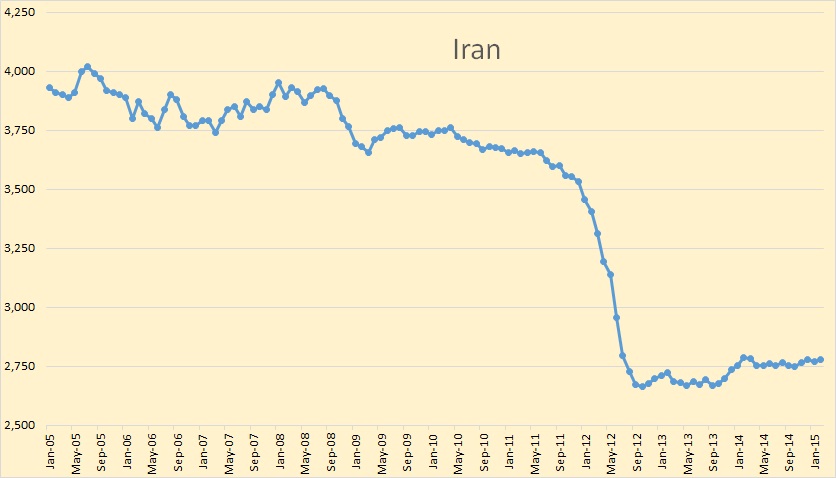
Iran production has been remarkably flat for about two and one half years. It is a question as to how much their production could increase if sanctions were removed.
It is remarkable that Iraq has been able to keep production as high as it is with all the ISIS problems they are having.
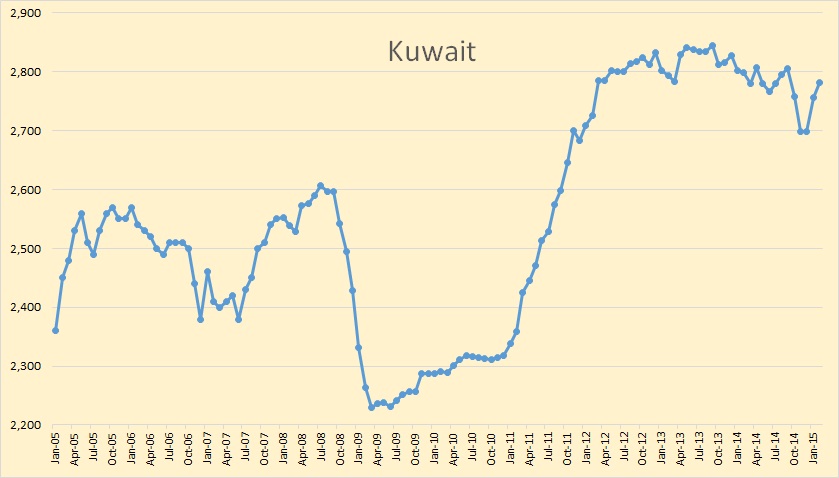
Kuwait was producing flat out in 2008 at 2,600,000 bpd. But when quotas were lifted in early 2011 due to the Libyan civil conflict, they began a huge infill drilling program and have managed increase production by around 200,000 bpd above their peak in 2008. production pretty much maxed out about two years ago.
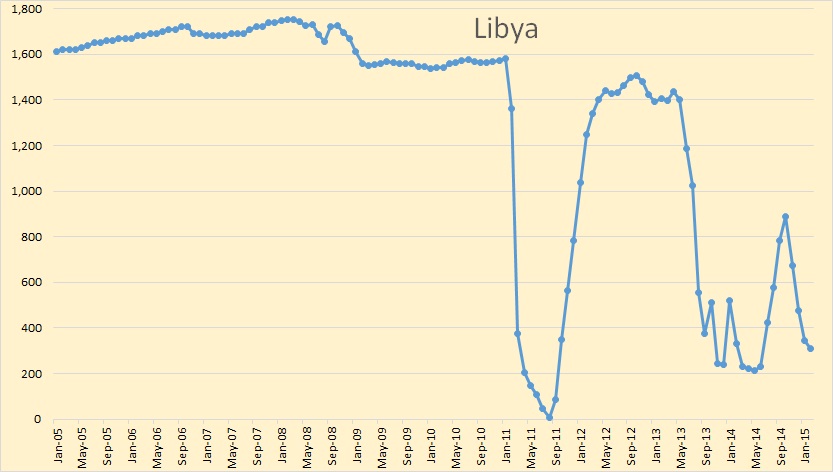
The Libyan conflict continues to impede production. They are now barely above 300,000 bpd.
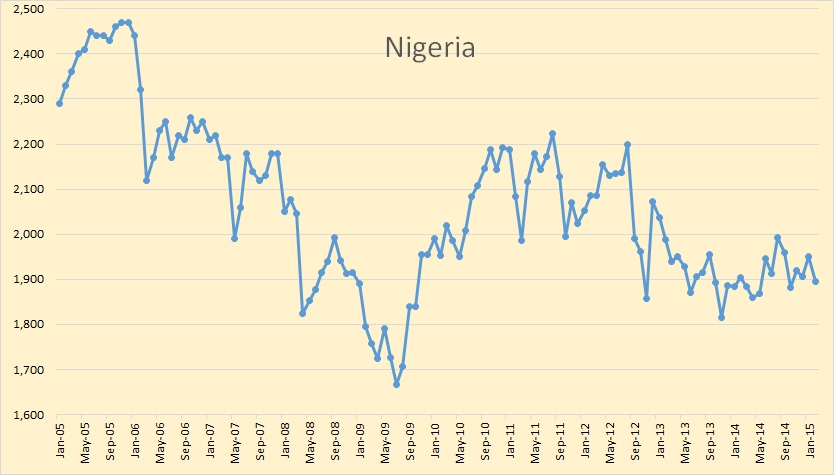
Nigeria is holding steady at around 1,900,000 bpd.
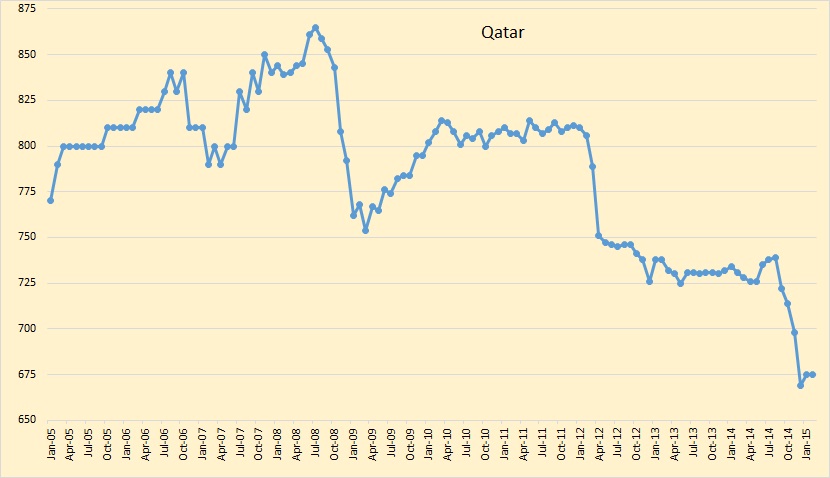
Qatar has stopped their decline, at least for now.
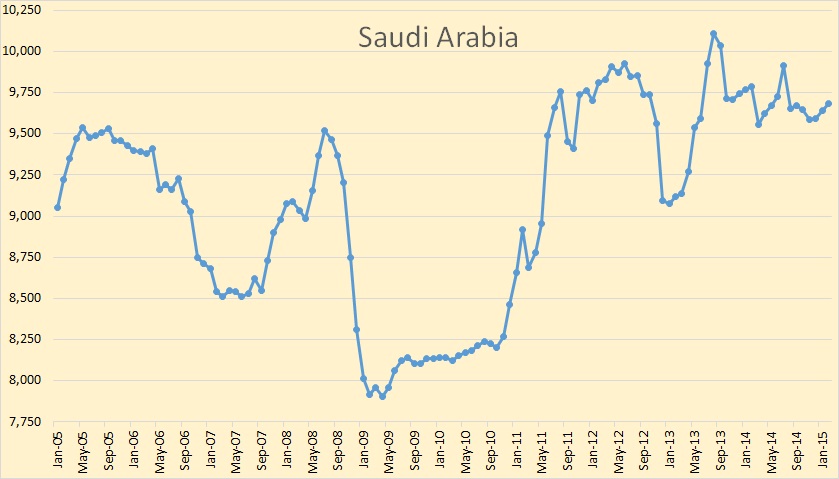
Saudi production has been holding relatively steady for about a year and a half now. They show no sign of either increasing or cutting production.
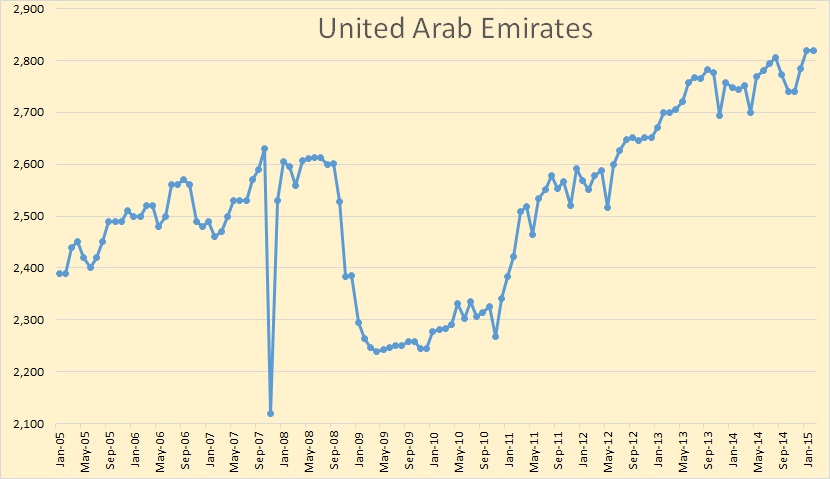
UAE, like Kuwait, began a huge infill drilling program in 2011. I think it has pretty much maxed out now.
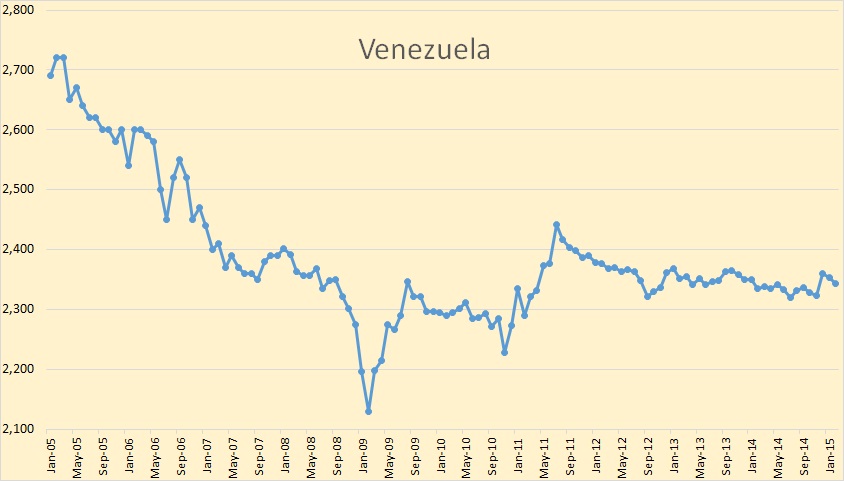
I keep waiting for something to happen in Venezuela… but nothing.
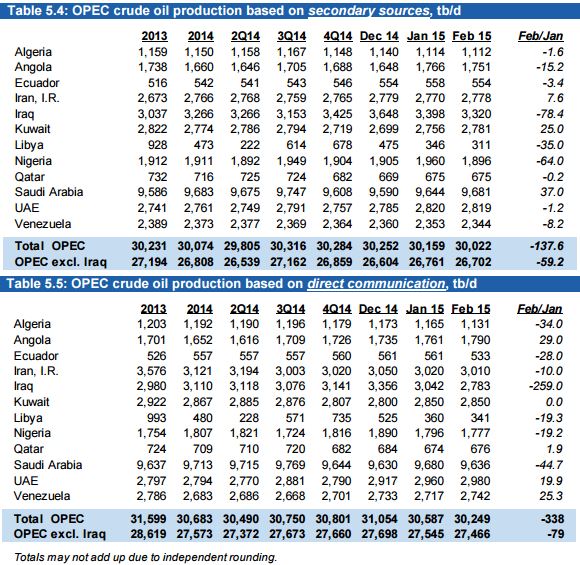
Here are the actual production numbers produced by the OPEC MOMR. The top chart, “secondary sources” is the one used for all my charts. The bottom chart, “direct communication” is what the countries reported when they were called by the MOMR. Notice that Iraq reported a decline of 259,000 bpd while the “secondary sources” had them down only 78,400 bpd.
In Other News: The Motley Fool says any decline in US oil production could be far in the future.
American Oil Production Is Still Skyrocketing: Will Oil Prices Tumble?
With oil prices having dropped by roughly 50% since last summer, U.S. oil companies have quickly reduced their investment plans and idled drilling rigs. Many pundits have assumed these actions would quickly be followed by falling production numbers.
While that might seem intuitive, it did not prove true. At some point, reduced drilling activity will inevitably lead to a fall in crude oil output — but that point could be far in the future. For the moment, domestic oil production is still rising steadily.
Output on the rise
Last week, U.S. crude oil production rose by 42,000 barrels per day compared to the previous week, reaching 9.37 million bpd.
The EIA said Wednesday that US C+C production reached 9.366 million barrels per day the week ending March 3rd. And because most people believe that was an actual measured number, oil prices have dropped steeply every day since. I have tried to explain to people that this number really has no hard foundation, it is an estimate.
I am sure the EIA uses some kind of algorithm to arrive at their estimate. It is likely based on the storage numbers, imports and refinery inputs. But all this depends on many reports from oil companies, pipeline officials and refinery officials and the truthfulness of those doing the reporting.
As an indication of the EIA past production estimating skills, I showed in my last post, how their estimate of production of six weeks ago, was off by a country mile. They estimated, on March 10th, that Bakken January production would be up by 27,300 barrels per day over December. But when the actual data came in from North Dakota, production was down by 37,000 barrels per day. Of course total Bakken production is somewhat different from total North Dakota production but the numbers give us a pretty good indication of the accuracy of their estimate. The total Bakken was likely down by pretty much the same number as was North Dakota.
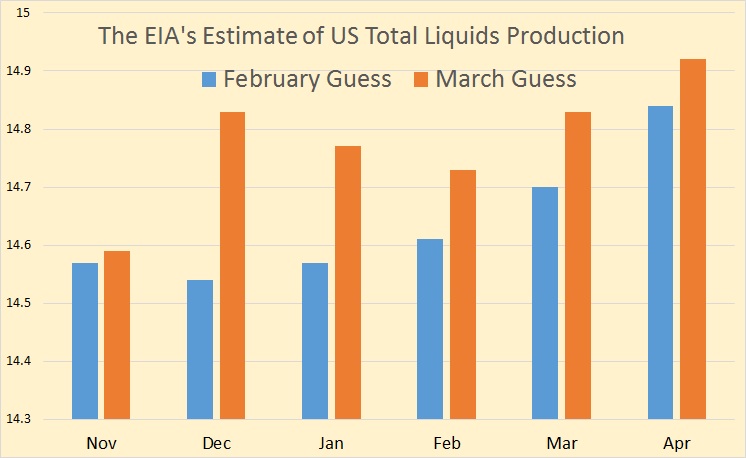
The data for the above chart was taken from the February and the March Short Term Energy Outlook. The data is in 1,000 barrels per day of Total Liquids. They decided in March that their February guess of what December production was, was 290,000 barrels per day too low. In other words, when the production they were trying to estimate was only 6 weeks in the past, they thought it was one figure, but after the data was 10 weeks in the past they had a better view so they jacked it up by 290,000 bpd.
But last Wednesday, they looked 5 days in the past and told us what the total US production of C+C was.
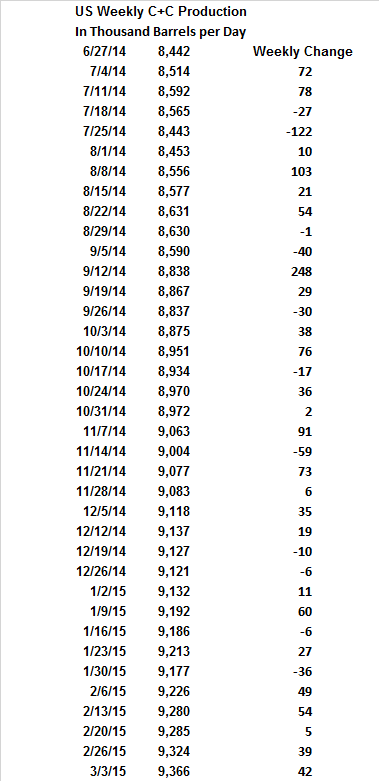
The above is the EIA’s estimate of US Weekly C+C production from the Weekly Petroleum Status Report. Notice the week ending 9/5/14 US production was down 40,000 barrels per day. But the next week it was up 248,000 barrels per day. Now it is highly unlikely that US production was actually down 40,000 barrels per day that week since the general trend was up. But it is a near impossibility that production was up a quarter of a million barrels per day in one week.
The EIA never revises the weekly numbers, they just adjust each weeks numbers to make up for any previous over or under errors in the data. So I am looking for another huge adjustment in the weekly production numbers soon.
3 Comments on "OPEC Crude plus More on EIA Estimates"
Plantagenet on Tue, 17th Mar 2015 9:09 am
Hmmmmmm. US oil production is still going UP
Looks like the oil glut is set to go on a bit longer
Westexasfanclub on Tue, 17th Mar 2015 9:47 am
If we assume a 12 month lag between rig count and US production, then we are now reaching the point when production should flatten before going south in autumn or winter.
Plantagenet on Tue, 17th Mar 2015 1:46 pm
That sounds about right to me, Westex