Peak Oil is You

Donate Bitcoins ;-) or Paypal :-)
Page added on April 7, 2014
Just How Good Are The EIA’s Predictions?

Folks here know that I like to post charts created from oil production data. But there has been a dearth of data lately. But not to worry, the data should start coming fast and furious later this week. However in the meantime I decided post a little about what the EIA expects in the future. They published the below comments and chart April 7, 2014. Bold mine.
Petroleum & Other Liquids
In the Annual Energy Outlook 2014 (AEO2014) Reference case, crude oil* production rises from 6.5 million barrels per day (MMbbl/d) in 2012 to 9.6 MMbbl/d before 2020, a production level not seen since 1970. Tight oil production growth accounts for 81% of this increase, and sees its share of national crude oil production grow from 35% in 2012 to 50% in 2019. In the High Oil and Gas case, U.S. crude oil production reaches 11.3 MMbbl/d in 2019 and reaches 13.3 MMbbl/d in the mid-2030s.
Under the Reference case, the import share of U.S. petroleum and other liquid fuels falls to about 25% during the last half of the current decade before rising again to 32% by 2040. In comparison, the High Oil and Gas Resource case projects that net U.S. oil imports will continue to decline through the mid-2030s and remain at or near zero between 2035 and 2040.
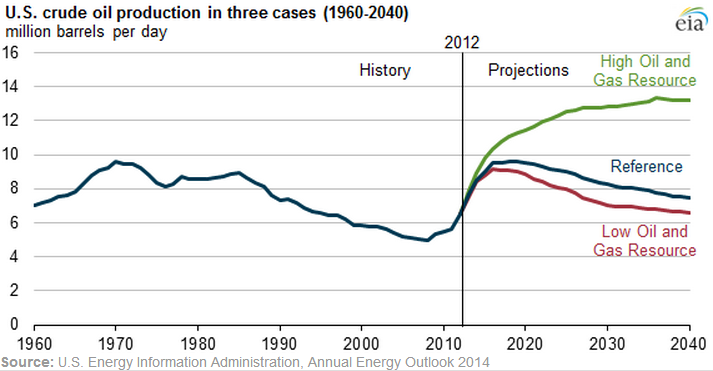
In the High Oil and Gas Resource case, tight oil plays an even more prominent role in driving national production growth, accounting for nearly two-thirds of total U.S. production by 2035, versus less than half of total U.S. production in the Reference case. Tight oil development is still at an early stage, and the outlook is highly uncertain. In EIA’s view, there is more upside potential for greater gains in production than downside potential for lower production levels. The High Oil and Gas Resource case assumes improvements in tight oil production technology beyond those in the Reference case, as well as higher well productivity rates.
Other assumptions reflected in the High Resource case include:
- Identification of additional tight oil resources
- 50% higher Estimated Ultimate Recovery (EUR) for tight/shale oil and natural gas wells
- 50% lower well spacing per acre for tight/shale oil and natural gas wells, with diminishing EUR for closely-spaced wells
- A 1% annual increase in the EURs for tight/shale oil and natural gas wells reflecting both abundant resources and technology advances
- Additional resources in Alaska and Lower 48 offshore fields
They are covering all base so how could they be wrong? But they say there is more upside potential than downside potential. That is, they think the high oil projection is more likely than the low oil projection. I would beg to differ because, so far, it is looking like the low oil projection is pretty much on track.
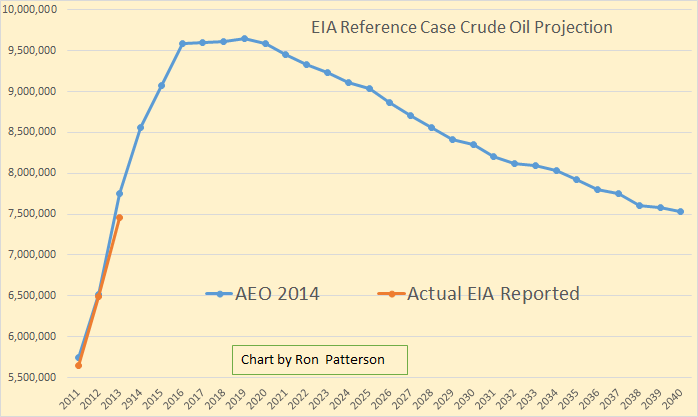 Average 2013 crude oil production came in 300 thousand barrels per day lower than the EIA’s projected reference case.
The EIA also projects what future imports are supposed to look like. Notice that projected imports are not in barrels per day but percent of total consumption.
In the high reference case the US becomes energy independent around 2036. In both other cases imports bottom out in 2016 and then head upward. So what’s all this noise about dropping the US ban on exporting crude oil?
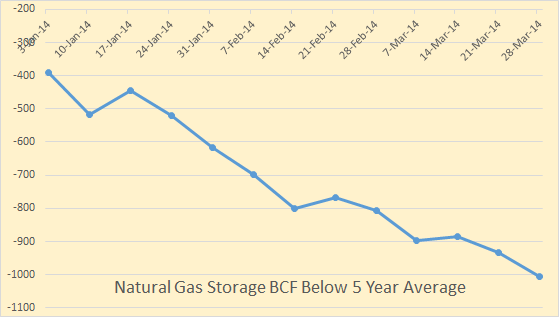
Natural Gas storage continued to drop. We were 1005 BCF below the five year average for the week ending 28 March 2014. This data can be found at: AmericanOilman.com
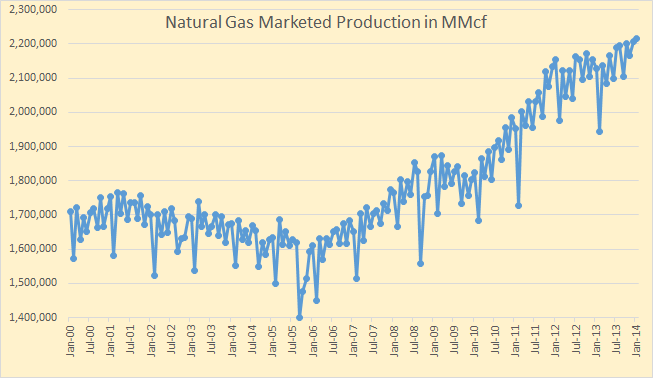
This is not because production is falling.
A really severe winter was one cause of the drop in storage but more natural gas fueled power plants is part of the cause also. As long as gas remains so cheap the situation is not likely to get any better. It is trading around $4.50 per MMbtu today, April 7.
Ethanol prices must be driving the price of gasoline up, not down.
*Crude Oil, in all cases here also includes Condensate.
Peak Oil Barrel by Ron Patterson
3 Comments on "Just How Good Are The EIA’s Predictions?"
Nony on Mon, 7th Apr 2014 11:35 pm
1. Oil: It’s normal and actually good (shows sophistication) for the downside and upsides to be non-symmetric. you actually don’t learn much in your modeling if they are symmetric. (I’ve done a lot of 10-50-90 modeling for acquisitions or capital investments.) You can even be as extreme as the 10 and the 50 being identical and the 90 being 2X (or the converse). For instance if there is a one customer/contract dependence for the revenue stream.
In this case, basically low and reference are similar and show known understanding of the tight oil plays already in existence. They’re really not even that controversial.
Step outside of the TOD-sphere and look at all the analysts evaluating the Bakken and Eagle Ford. The optimists have done a lot better than the Picollo/Rune/Gail types. The difference to the extent that I think we have to suspect doomers of not being intellectually objective (what they accuse others of). The whole thing has spiraled to the extent that really peakers have become a weird, conspiracy-minded group. TOD died for a reason…remaining adherents are even crazier.
2. Gas: Yes, Ron…people are unlikely to drill (much) for gas given a low price. But that’s putting the cart before the horse. The reason price is low is because adequate capacities of gas can be obtained at these prices. The current price as well as the futures prices shows that the market is not worried about some Berman decline theory (boy has he had his butt kicked by the Marcellus since 2009). The market is interpreting the low storage of this past winter as a harsh winter (hard to predict) rather than a systemic supply/demand issue.
GregT on Tue, 8th Apr 2014 5:09 am
Nony,
Are you a human being, or a computer generated program with no emotional attachment to reality? Good God girl, wake up.
Nony on Tue, 8th Apr 2014 12:29 pm
If Skynet wanted to troll instead of attack humanity…
😉