Peak Oil is You

Donate Bitcoins ;-) or Paypal :-)
Page added on May 18, 2014
Jean Laherrere’s Take, Plus Other News

Jean Laherrere sent me the below post and asked me to post it in reply to comments posted by Dennis Coyne and Political Economist on my post Bakken Update, March Production Data. But that was several days ago, the comments are stale. Also it was too large for a comment. So since we are a period where there is a dearth of data, I decided to make a post of it. Below Jean’s graphs and comments I have added a couple of news Items.
_______________________________________________
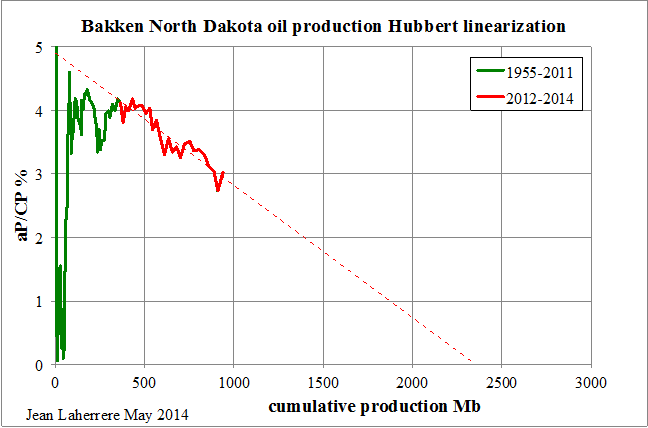
Policial Economist displays a graph for Bakken production Hubbert linearization trending towards 3.5 Gb, but it is from EIA DPR for the period January 2007 to June 2014 : it is not real data (we are not yet in June 2014) but estimates.
It is different from mine trending towards 2.4 Gb, but it is only for North Dakota Bakken using ND state data from 1955 up to March 2014.
In many of my papers I state that production Hubbert linearization is not very reliable and it is better to rely on the creaming curve of cumulative backdated 2P discovery versus cumulative number of fields. But for LTO there is no reliable way to estimate 2P reserves, because only the volume generated by the source rocks (using Rock Eval measures from cores) can be estimated but the amount lost from this generated oil and gas cannot be estimated and the recovery from what is left within the fractures needs longer historical data.
The ND production excluding Bakken Hubbert linearization trends also towards 2.5 Gb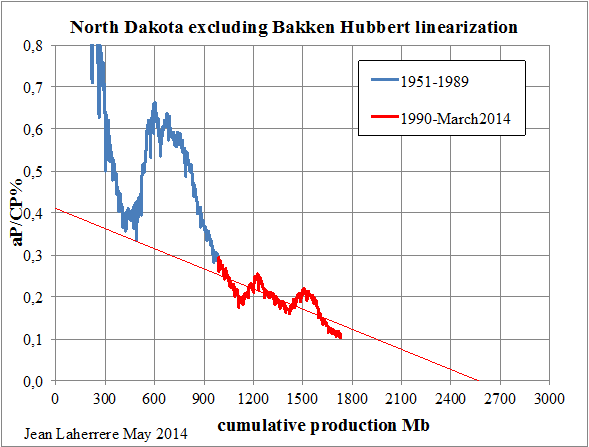
It is why I use a NG oil ultimate of 5 Gb with both 2.5 Gb for Bakken and non-Bakken.
Petroleum Economist suggests that I have confused Bakken data with Eagle Ford data :
Ron, you may want to double check with Laherrere if the above graphs were not sent by mistake.
I am old but not yet senile !
Dennis Coyne who makes many and good graphs wrote May 15, 2014 at 7/58 AM :
Thus the USGS believes that there is a 95% probability that the TRR of the ND Bakken/Three Forks will be at least 7.4 Gb. If there are no proven reserves added to ND Bakken/Three Forks the 2.4 Gb URR estimate is still likely to be 3.9 Gb-2.4 Gb= 1.5 Gb too low.
The mean (F50) USGS estimate of ND Bakken/Three Forks is 9.7 Gb. The F95 estimate is 7.4 Gb and the F5 estimate is 12.9 Gb.
As these are rough estimates it is more appropriate to round them so F95=7 Gb, F50= 10 Gb, and F5= 13 Gb.
My guess is that there is about a 99% probability that the TRR is at least 6 Gb.
When some one claims that he is 99% sure of the ultimate reserves being 6 Gb, means that he does not understand accuracy and probability and is incompetent in reserves estimate.
My guess is that there is about 90% probability that Dennis Coyne has never estimated oil reserves. As far as I can find on the web he is general manager of marketing with Tesoro in Texas.
TRR (technically recoverable resources ) is not what will be produced, which is what is economical!
Since 2000 USSG is estimating the world oil undiscovered resources using only six values to guess the sizes and the number of undiscovered fields (called the seventh approximation sheet see my papers:
Is USGS 2000 Assessment Reliable? by Jean Laherrere, published on the cyberconference of the WEC on May 19, 2000
Do the last 6 years production confirm the USGS forecast for the period 1996-2025? by Jean Laherrere August 2002
USGS is only giving the result of their wild guesses which go through a Monte Carlo simulation (50 000 runs) to look real.
USGS 2000 forecast for East Greenland undiscovered (number of undiscovered fields: minimum 1, median, 250, maximum 500 & size of undiscovered fields: minimum 20 Mb, median, 85 Mb, maximum 12 000 Mb) at 47 Gb was changed later in 2007 (FS07-3077) to 9 Gb (mainly by changing the minimum number of fields from 1 to 0 and the minimum size from 20 Mb to 50 Mb).
It is amazing to see such drastic change in the assessment just by changing the minimum from 1 field to zero field.
All these USGS guesses were done without any well and any seismic.
How to estimate future oil supply and oil demand? by Jean Laherrere
In 2000 USGS said that there are 95% of finding
I do not trust at all USGS undiscovered assessment: it was done in 2000 from the guess of only one geologist (Henry for Greenland) when before with Chuck Master it was the estimate of a Delphi enquiry involving many geologists.
There were several USGS estimates for Bakken undiscovered: the last one in 2013 reports 7.4 Gb (covering North Dakota, Montana and Saskatchewan), when in 2008 it was 3.65 Gb, but in 2005 it was only 0.17 Gb. Such variation means that it is mainly wild guesses, never estimating the past discovery and its extrapolation (like I do with the creaming curve)
Dennis Coyne May 15, 2014 at 5:48 PM
His Gulf of Mexico estimates are also pretty low relative to the BOEM estimates which conservatively estimate undiscovered TRR at 39 Gb (F95 estimate). Then we need to add the 16 Gb already produced, and the 9 Gb of proven reserves, to get a TRR of 64 Gb. The BOEM estimates that there is a 95 % chance that the TRR will be at least this high in the Gulf of Mexico, Mr. Laherrere estimates 25 Gb, so I think he misses the mark here as well.
Link to BOEM report below:
BOEM Assessment of Undiscovered Technically Recoverable Oil and Gas Resources of the Nation’s Outer Continental Shelf, 2011
See page 5 table 3 for proven reserves and oil produced and page 3 table 1 for UTRR estimates.
BOEM estimate of undiscovered offshore (OCS) resources is similar to USGS assessment: they do not care to compare the yet to find to the past discoveries and they dot not give any detail on their work, only the result.
Like USGS the variation of their assessments with time varies wildly and the oil range in 1996 is outside the range of the next assessments in 2001, 2006 and 2011.
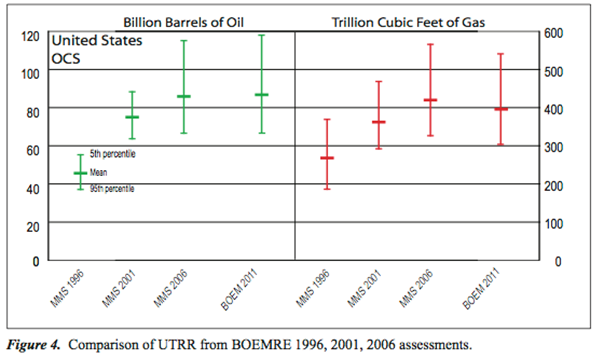
These assessments are not reliable.
BOEM 2011 (Link above) for the GOM estimates the mean undiscovered technical reserves at 48 Gb and the cumulative GOM oil production at end 2011 is 15 Gb with proved reserves at 5 Gb, meaning an ultimate of at least 68 Gb.
But BOEM reports the backdated field reserves of every GOM field (from 1998 to 2009) and the cumulative number of fields and the cumulative oil discoveries vary with time.

For end of 1998, 1998 survey reports 984 fields, but 2009 survey reports 1087 fields: about 100 fields missing, meaning more than 10%: cumulative discovery is 14.3 Gb for 1998 report and 18.1 Gb for 2009 report: this 3.8 Gb difference is due to missing fields and reserve growth with oil price.
It is amazing to find that 10% of the fields are missing in official reports in federal waters!
The plot of the backdated (end 2009 and end 1998) oil discovery is plotted as a creaming curve (versus the cumulative number of fields);
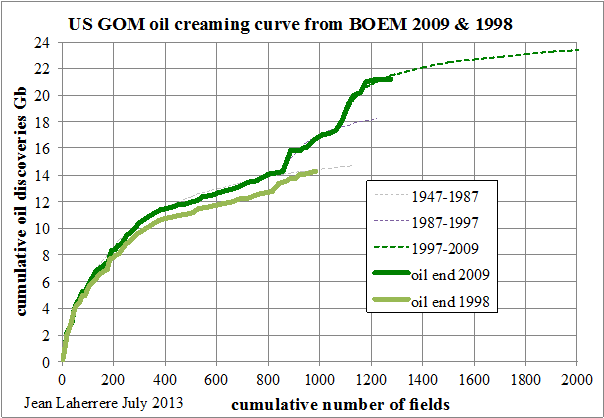
1988 data before the deepwater discoveries misses the subsalt large discoveires.
The 2009 data is modeled with 3 cycles with the last one (subsalt) trending towards 24 Gb. A fourth cycle is possible but it is unrealistic to see this crealing curbve trending towards 68 Gb as assessed by BOEM.
The plot of the backdated discoveries versus time (2009 and 1998) is compatred to the cumulative production and the current proved reserves by USDOE.
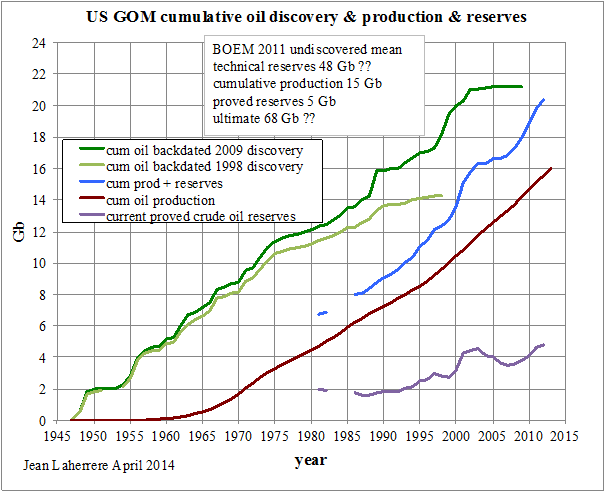
USDOE should be using BOEM data and the blue curve in 2009 should be equal to the BOEM total which is 23 Gb, in fact it is 19 Gb.
USDOE is not reporting BOEM data: it could be due to the State waters.
The backdated discoveries in green is flattening when the current proved reserves plus cumulative production in blue is sharply rising since 2007.
It is the problem pf proved reserves due to the SEC rules: they are financial data (minimum data and it is incorrect to add arithmetically the proved field reserves to get the proved reserves of the GOM: there is a huge underestimation. This poor practice explains the aretifiacl reserve growth.
See my paper -Laherrère J.H. 2011 «Backdating is the key » ASPO 9 Brussels 27 April
ASPO-9 INTRODUCTION ! Backdating is the key, Jean Laherrere
Dennis Coyne who makes good graphs should look more in detail the above graphs in order to be more reluctant to believe the assessment of ultimates using current proved reserves to please theSEC and the bankers.
Tesoro is not using proved reserves when deciding the development of a field: they used Net present Value based on the mean reserve values and not the proved reserves.
End of Jean’s post._____________________________
Chris Nelder predicts world oil production to start to decline in 2015. Below is the link to a one hour podcast from the Extraenvironmentalist and a transcript of a few minutes of that podcast.
Chris Nelder on Energy Transition
Starting at 29:40 into the podcast:
Question: Building renewables won’t ever work because of the drop-off in oil production and the difficult economic consequences that will have, especially later this decade, would actually prevent us from building up a renewable energy infrastructure. What do you have to say to that kind of argument?
Chris Nelder: I have made that argument myself, I am very concerned about it. If we do in fact have global oil production beginning its decline around 2015, which has been my call for quite a few years now, and when you actually calculate the decline rates and you look at how much oil will be lost on the global market year after year after year and then you start to think about what is the effect on the global economy of losing 5% and then 10% and then 20% of global oil production.
It doesn’t take a huge leap of imagination to think, wow, it’s going to be difficult to maintain a functioning economy. It’s going to be hard to maintain global shipping. It’s going to be hard to maintain an industry of big wind turbines where the supply chain for parts for those turbines might go all the way around the world. So my view has been that we should build as much renewable capacity as possible for the next 20 years while the availability of oil is reasonably good and the price is reasonably acceptable. I think that once you get out past 2030, 2035, it’s going to be quite difficult, and quite expensive to build anything or deploy anything that requires a lot of shipping or that requires parts coming from all around the world.
And a bit later in the podcast, his opinion of the Steve Kopits Presentation:
Kopits, his presentation was fantastic. Anyone could spend an hour looking at his presentation would understand everything they could possibly need to knowabout the global oil supply and demand and price situation. It was just a perfect encapsulation of everything you need to know. But one of the key things that he really brings out in his presentation is that historically everyone has modeled future oil supply from a demand perspective. That’s what the IEA does, that’s what the EIA does, and that’s what the whole alphabet soup of agencies do. You know they just forecast demand and they say, “well there will be supply and it will be at an acceptable price”. And that fine while you are in over a century of continually growing oil supply that’s relatively cheap. But that’s not the case anymore. We’ve exited that era in history. We’ve gotten into a supply constrained world.
And from Platts:
IEA looks to OPEC to boost oil production as output growth elsewhere slows
It has become increasingly clear that the world market cannot rely on non-OPEC supply growth given geopolitical events outside OPEC.
The IEA said the downward revision was due to lower forecasts for Azerbaijan, China, Colombia, Kazakhstan, Mexico and South Sudan.
The agency singled out Colombia and South Sudan as particular areas of concern, saying new “politically-driven disruptions have intensified” in both countries.
The IEA is still predicting an increase in Non-OPEC liquids but they are looking to the US and Canada to provide virtually all that increase.
And this is interesting: What the Frack: N.D. Oil Well Ron Burgundy Is Leaking, But They Don’t Have To Tell Us How Much,
Alarmingly, 22% of oil booming North Dakota’s 1,813 oil and gas wells are now on its “Confidential Well” list, probably because the state automatically awards such “tight hole” status to any operator who asks without having to offer any justication other than, in the words of one, “because we can.”
Okay, so the well is leaking pretty bad. But the point I wish to make is it seems that a lot of wells in North Dakota are coming up with very little oil. But the oil companies can keep that confidential for as long as they wish. And when they do release the well from “Tight Hole” or Confidential status, they still don’t have to tell you how much oil or water the well produces. Many do but many do not. Check the Bakken Blog and click on “ND drilling permits issued week ending May 16″ and you will see what I mean.
Total numbers from all a companies wells are reported to the North Dakota Department of Mineral Resources but apparently they are not required to break it down by individual wells. That is they do not have to report production from each well. That is why county by county production numbers are often way off. Anyway would I expect the dialogue would go something like this:
Big Boss: How did that last well come in?
Drilling Boss: Not too good, 56 barrels of oil per day and 571 barrels of water per day.
Big Boss: Okay, better put that one on the “Tight Hole Confidential” list, we don’t want to upset the investors.
My final comment: It is looking more and more like 2014 will be the year Crude+Condensate peaks. It all comes down to US Tight Oil in the Bakken and Eagle Ford and Canadian oil sands. Even if tight oil does not peak this year, any increase in production after 2014 will be slowed dramatically. With the world’s largest crude oil producer, Russia, now in decline, there is just no way any the US and Canada can make up for the shortfall in the rest of the world.
One Comment on "Jean Laherrere’s Take, Plus Other News"
Plantagenet on Sun, 18th May 2014 11:47 pm
Prof. Laherre assumes that the USGS estimates of Bakken oil are “wild guesses” because their estimated reserve number keeps getting larger. But in actuality the lowest number was made before fracking even began, and the two larger numbers reflect improving geologic data obtained from thousands of drill holes.