Peak Oil is You
Donate Bitcoins ;-) or Paypal :-)
Page added on March 16, 2014
Growth in US Hydrocarbon Production from Shale Resources Driven by Drilling Efficiency

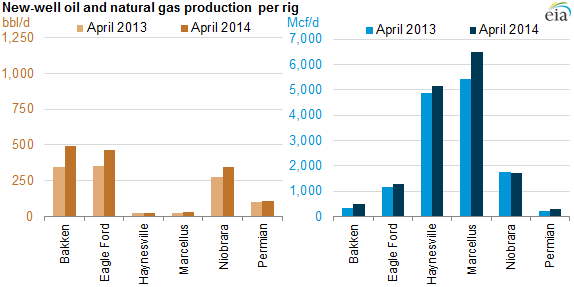
The productivity of oil and natural gas wells is steadily increasing in many basins across the United States because of the increasing precision and efficiency of horizontal drilling and hydraulic fracturing in oil and natural gas extraction. Many resource-producing basins are experiencing an increasing yield over time in either oil (Bakken, Eagle Ford, Niobrara) or natural gas (Marcellus, Haynesville).
The geology of each oil and natural gas resource play is diverse, and individual rig or well performance can vary dramatically. However, drilling activity in U.S. shale plays is now generally producing greater quantities of oil and/or natural gas than in the past.
As noted in March’s productivity report, five of the six U.S. shale plays tracked by the DPR have seen increases in oil and natural gas production per rig over the past few years. According to EIA’s March DPR, the Eagle Ford Shale is leading in increased production of oil per rig, and the Marcellus Shale is leading in increased production of natural gas per rig.
DPR data show that each drilling rig in the Eagle Ford Shale will contribute over 400 barrels of oil per day (bbl/d) more in April 2014 than it would have in the same formation in January 2007. At the same time, the DPR also shows that a Marcellus Shale well completed by a rig in April 2014 can be expected to yield over 6 million cubic feet of natural gas per day (Mcf/d) more than a well completed by that rig in that formation in 2007.
This trend of increasing rig productivity is one factor helping to increase the nation’s oil and natural gas production. The latest Annual Energy Outlook forecasts that U.S. oil production will reach 9.6 million barrels per day in 2019, and natural gas production will increase by 56% through 2040.
19 Comments on "Growth in US Hydrocarbon Production from Shale Resources Driven by Drilling Efficiency"
eugene on Sun, 16th Mar 2014 2:35 pm
In the land of dreams and schemes, wishful thinking dominates.
ghung on Sun, 16th Mar 2014 2:56 pm
Revision: Growth in US Hydrocarbon Production from Shale Resources Driven by $100 Barrel Oil.
There,, fixed it.
Aaron on Sun, 16th Mar 2014 3:05 pm
Isn’t this just because it takes a little while to identify the sweet spots. Once they’ve been identified, they are exploited with fewer unproductive wells, thus driving up the new well production average?
Northwest Resident on Sun, 16th Mar 2014 3:23 pm
Repetition is the key to learning, and they are repeatedly drilling and fracking more holes in the shale plays. They’re learning how to scrape the bottom of the barrel a little better than before, producing extra quantities of NG and oil that amount to almost nothing relative to the enormous demand for NG and oil. But every little bit helps, I suppose.
bobinget on Sun, 16th Mar 2014 3:40 pm
GE, serious about its oil and gas services division is spending two billion a year, till 2020 on co/2 injection,
waterless fracking research along with Norway’s Statoil, (STO)
I reported last year GE had broken ground in Utah on a new waterless fracking research facility. If I know GE, they will buy out any company, private or public that masters waterless fracking technology.. One Canadian company, “GasFrac” uses gelled liquid petroleum in Texas with mixed success . Statoil, well away from US borders will be GE’s test bed.
IMO, CO/2 has a better ‘ back into the ground’ image than highly explosive gelled liquid hydrocarbons.
It’s my belief, for investors, especially in this initial
exploration period, drillers, tech support is the place to be. Look at Core Labs, SeaDrill.
Nony on Sun, 16th Mar 2014 4:18 pm
There definitely is an effect of learning/efficiency going on. That it helps fight the other aspects of lower results from downspacing, from moving to the edge of the sweetspot, etc. While the charts here are interesting, they don’t really go far enough in analysis.
1. You need to consider development history of the overall basin and factor that out. Let me explain. Imagine a play, where drilling is exactly the same, geology the same, and IPs and EURs the same. The only thing changing is more of the same over time. What happens is that the decline curve for the overall basin goes down over time. Because the new wells (fastest declines) are a smaller portion of the total. So the good results of the Bakken are kind of understandable. However, the Marcellus (since it is a relatively young gas play) is really showing learning. You can see this on yearly IPs, too.
2. It would be interesting to look at total investment versus total new oil (or say, 1 year IPs). That would show the battle of geology versus engineering more.
3. Some of the factors for increased efficiency:
*more pad drilling, walking rigs, etc. versus HBP drilling.
*more established infrastructure (people, pipes, service providers)
*better fracking (stages, proppant, etc.)
*Better understanding of the near well or overall play geology.
*lateral length, multi lateral wells
I’m not sure how to try to disentangle these, but it would be interesting (come on Drilling Info blog!)
Nony on Sun, 16th Mar 2014 4:19 pm
P.s. I don’t understand the April 2014 data. (in the future from now!)
PapaSmurf on Sun, 16th Mar 2014 5:07 pm
“In the land of dreams and schemes, wishful thinking dominates.”
———————-
In the land of gloom and doom, twits and idiotic thinking dominates.
rockman on Sun, 16th Mar 2014 5:34 pm
Not that the data isn’t correct but they neglect to point out a couple of major factors in the improvement of individual well performance. I’ll address the Eagle Ford since I’m much more familiar with that play. When the play started laterals were just 1500′ to 3000′ and frac’d with just several stages. Now laterals out to 7000’+ with 20 or more frac stages are not uncommon. So naturally productivity of the wells have increased. But so has the costs. Early wells might have cost $4-6 million drilled, completed and frac’d. Now costs exceeding $10 million are not uncommon. If fact it’s not uncommon for the frac op to cost more then the drilling phase. So a better representation would be to normalize by lateral length…or perhaps by cost/bbl.
But another complication: drill time. New tech, in particular rotary steerable downhole equipment, has significantly improved the p-rate…penetration rate. Measured in feet per hour. Given a large portion of drilling cost are time dependent this has a big impact on final cost. Improvements led to 30-day wells being drilled in 18-days. But don’t look for any significant improvement in this regard…the curve has been learned and the equipment optimized.
Unfortunately it’s very difficult to find that data needed for normalization without researching the details of each well on the TRRC website. And that would take many hundreds of hours.
And here’s one interesting comparison between the two big unconventional oil plays. It shows the difficulty of making generalizations about the different trends:
Eagle Ford wells are producing better than the Bakken Shale of North Dakota and Montana. A typical well in the Eagle Ford averages 300 to 600 bopd in its peak month of production, compared with 150 to 300 bpd for a Bakken well, according to the study. Current Eagle Ford production is just half that of the Bakken, but the ND shale play had a 10-year head start. A little over 200 rigs are drilling in the Bakken vs. ~250 in the Eagle Ford. It’s also worth noting that horizontal laterals are consistently 10,000 ft in the Bakken. That’s roughly double the most common lateral length in South Texas. That means the Eagle Ford is out producing the Bakken with as little as half the reservoir contact.
shortonoil on Sun, 16th Mar 2014 6:10 pm
Drilling efficiency has only been a small part of the increased production of shale reserves. The main contributor has been improved reservoir simulation. Except for the Bakken, which is a true oil play, the majority of the shale plays are condensate/gas plays. They are one phase gasses at high pressures and temperatures. The reservoir pressure falls as the wells are produced because they are gas drive wells. As the pressure falls the dew point of the reservoir is hit, and the heavier fractions condensate out in the well, where they are lost.
Oil companies have been trying for decades to find ways of preventing condensate loss. In 1988, Gasprom of Russian at their Vuktyl field, tried pumping 25,800 tons of propane, and butane down their wells as diluent to recover lost condensate. It didn’t work. Chevron at their Hatter’s Pond field pumped 1,000 bbl of methanol down a dying well to recover lost condensate. Huff and Puff, injection of dry gas into condensate wells, is a common treatment. CO2 as an EOR method has been used since the 1940’s. The problem always has been, and still is getting a source of CO2 to the well being treated.
The number of variables affecting a condensate well are very large, and difficult to acquire. Translating those quantities into an optimal production schedule is even more difficult. Companies like Schlumberger have been very active at providing more advanced field testing and analysis technology. This type of research has increase URR from condensate wells considerably. In the Eagle Ford URR has increased from 9 to 17% for some wells because of improved reservoir simulation methods.
Why the EIA thinks that production of shale has increased because fewer rigs can drill more holes when there are idle rigs sitting is a little strange. Maybe the key word is “thinking”.
http://www.thehillsgroup.org/
Nony on Sun, 16th Mar 2014 7:43 pm
A weird idea/thought that I had. Is there (might there be) a benefit to how the stages are located compared to the other nearby laterals? For instance having them directly across or having them checkerboard. If X is a frack and O the unfracked. Then something like this, for nearby downspaced laterals:
XOXOXOXOXOXO
OXOXOXOXOXOX
XOXOXOXOXOXO
OXOXOXOXOXOX
-or-
XOXOXOXOXOXO
XOXOXOXOXOXO
XOXOXOXOXOXO
XOXOXOXOXOXO
Which works better or is it irrelevant?
They are already checkerboarding depth versus sideways (see the CLR or Oasis downspacing). But that’s for the whole lateral. What about coordination of the stages themselves?
rockman on Sun, 16th Mar 2014 9:29 pm
Nony – Outside my area but operators have been playing with such ideas for a while. Some put their fracs equally spaced. Others will frac where they detect natural fractures. Others will try a combination approach. And there has been chatter about trying extend fracs from one lateral to an offset lateral. But it’s good to remember where one pumps a frac along a lateral it isn’t always very predictable where it goes and exactly how effective it is.
And such a timely point for you bring up. Just last Friday morning I had a presentation from a vendor with a system Statoil helped to develop. It allows an estimate of what percentage of the oil production is coming from different intervals along the laterals. Imagine a 5000′ lateral with 10 frac stages. So a frac every 500′. It makes 1000 bopd. But from where: 100 bopd from each frac or 800 bopd from one frac and 200 bopd from the other 9 feds combined? Too long a story to explain the tech but search “Resman” if interested.
What’s interesting is it’s been used a good bit overseas but only by one operator in the Bakken and none in the Eagle Ford. I don’t frac but I am drilling laterals in old conventional oil reservoirs and have the same critical question: where exactly is the oil entering the lateral. From what I can tell besides being the first operator to succeed with this type of completion in the onshore Gulf Coast I’ll be the first to use the Resman tech to evaluate the results in this type reservoir in the US. It’s truly great to have an owner that loves tech and is willing to not only think outside the box but pay for it.
shortonoil on Sun, 16th Mar 2014 9:45 pm
The Eagle Ford has a Brinell number of 22, which is a very soft stone. That is in comparison to the Barnett with a BHN of 80. Fracture half lengths for the Eagle Ford are limited to about 500 feet because it is so soft, and fairly weak grained. As long as the laterals are 1200 feet, or more apart the spacing wouldn’t have any effect. Fracture spacing is the more important factor. Generally down to 100 ft production increases, and recovering increases. But since it is more costly, the economic limit is usually considered to be about 200 feet.
http://www.thehillsgroup.org/
Nony on Sun, 16th Mar 2014 10:29 pm
Rock:
Thanks for kind remark. I know thjere is a lot of playing around, and really doubted that I would have this idea first, but I just haven’t heard of this exact thing. Seen the zipper fracks and checkerboard for depth versus spacing. Anyway…I can take credit for thinking of it on my own, even if it’s well known/tested idea. 😉
I think more logging could be a great idea for these plays where we don’t really understand the macro/micro structure. Or the fluid flow. Not like hitting a trap and just floating oil out with water drive.
Good luck with your testing and I hope it helps more oil be extracted for the world (as well as making you/your boss rich).
I am not in petroleum industry, but interstingly had just surfed onto this story, today, which had some comments on slow adoption of technology. Hard for me to really gauge it. Is it an industry where everyone catches up via service companies and employee movement? Or one that is slow to learn.
http://www.epmag.com/Production/Great-ideas-benefit-production_49853
You would think that it would be an industry, that equalizes and learns. Because people are so risk taking and money aware. But then also, there are a lot of confounding factors, so different methods of well completion may be hard to disentangle from geology.
rollin on Mon, 17th Mar 2014 2:44 am
Greater drilling lengths, more fracs per length, increased pad drilling all have given a greater output per well. I wonder if this is the initial output, since the wells decline so rapidly. Putting the best number forward.
Problem is that, as Rockman stated, the wells cost more now since so much more effort is put into them. They started with an expensive low output system , made it more expensive with higher output per well. Still making a profit in the long run because the per barrel cost is so high.
Nony on Mon, 17th Mar 2014 4:04 am
Yeah, well Picollo/Gail called the peak at 200 k bpd in late 2008 and Rune predicted 650 +/- 50 as late as JAN2013. So, somehow the peakers look a little non-objective on their analysis.
Calhoun on Mon, 17th Mar 2014 10:36 am
Meaningless graph since it doesn’t say when the max bbl/day figure was reached or how long it was maintained or what the decline rate was afterwards or what it cost to get there. My guess is that the investment per well pretty much follows the peak output per well, which would offset any economic advantage.
The big question in my mind is Why did the EIA publish this shameless tout piece? Is it because of all the recent news about investors getting cold feet? Is it the government’s little way of encouraging further investment? I’m certain these graphs will show up in many company presentations.
rockman on Mon, 17th Mar 2014 12:00 pm
Nony – A real life story about how complex the effort can be. While at Devon I was asked to evaluate a horizontal core taken in one of their Haynesville Shale wells. They drilled it with a relatively light mud weight (10.5 #/gallon) and got no indication of productivity. When I studied the core analysis it revealed no porosity or permeability in the core at all. Unfrac’d this well would make 1 cuft/day. But they frac’d it and the well flowed 6.5 million cuft/day at a pressure equivalent of 14.5 #/gallon mud weight. I told them they could have drilled it with air…no mud…and they would not have gotten any indication of productivity. Obvious when they frac’d the well it tied into a natural fracture system not far from the well bore. And that gives a far indication that no matter how much tech is applied Mother Earth still ends up controlling much of the results. And she tends to hide her secrets very well. On average the plays tend to work. But looking at individual well results can be very confusing/misleading in both a positive and negative manner.
Nony on Mon, 17th Mar 2014 3:03 pm
Rock:
I hope you get to look at enough wells to disentangle the random variations from general trends. Is this a field that uses DOE and statistics much? You are dealing with multifactor problems, a lot of variation, and limited amount of tests (expensive to drill holes).
I’m reading the 2000 paper by Price and Lefever. He was an interesting old duck (dead now), who touted the Bakken as a big play. Obviously his info is dated (since we have 10,000 producing wells now), but he did look at a huge amount of cores. Some things he said were prescient, even controversial.
Others he’s off on. He and Lefever did talk a lot about how advancement in efficient horizontal fracturing was needed. Although, the costs have not dropped to what he thought they would (he argued the play would become exploitable even at 20/bbl).
I lack basic subject matter knowledge of geology and petroleum engineering (and I know it). Even things like “dolomite” or “PUD”, I have to look up on the Internet. Much less having the general perspective on the science/industry. But I am used to reading up on industries that I haven’t studied/worked in. And basic mechanical engineering (fluid flow) and chemistry (alkanes) makes the stuff mostly readable.
Anyway it is kind of fun to follow from the sidelines. I wish there were some good non-peaker discussion sites. I don’t resent the TOD refugees having a home of their own and I’m sure I’m a fly in the ointment. Just don’t know another good amateur analysis site.
P.s. Go little Bakken, go!