Peak Oil is You

Donate Bitcoins ;-) or Paypal :-)
Page added on July 15, 2014
EIA’s Drilling Productivity Report

Just as I was finishing this post North Dakota published their production numbers for May 2014. North Dakota production was up over 36,000 barrels per day on 227 new well completions according to The Director’s Cut. I will have a post on all that tomorrow.
The EIA’s Drilling Productivity Report has just came out. Below are a few charts gleaned from that report. The World’s seven largest publicly owned oil companies have peaked. Their combined production has declined 12.4% since 2009.
The Drilling Productivity Report shows, or tries to show, the true decline rate of shale oil and gas. I usually only track the oil however.
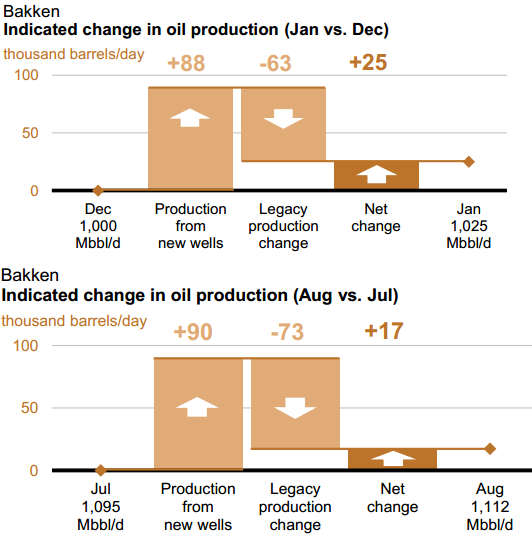
In January the EIA estimated that Bakken production from new wells would equal 88 kb/d. They estimated that the declines of all older wells would equal 63 kb/d leaving net production at 25 kb/d.
In August they estimate that Bakken production from new wells will equal 90 kb/d or 2 kb/d above January new well production. They estimate that the decline from older wells will equal 73 kb/d, an increase of 10 kb/d from January, leaving a net increase in production of 17 kb/d.
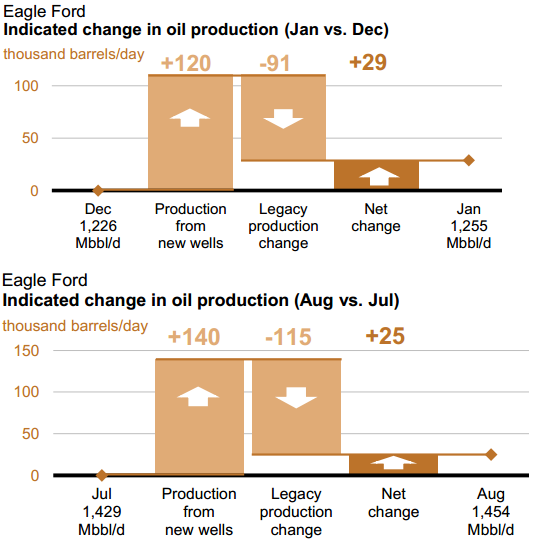
Eagle Ford fared a bit different. In January they thought new well production would increase by 120 kb/d while older wells would decline by 91 kb/d leaving net production 29 kb/d. In August they expect production from new wells will equal 140 kb/d, a whopping 20 kb/d over January numbers. However decline from older wells will have increased to 115 kb/d, 24 kb/d more than it was in January, leaving net production up 25 kb/d. So in spite of the 20 kb/d increase over January new well production, net production will still be 2 kb/d lower than January.
Looking a little closer at the Bakken and Eagle Ford decline and the decline trend
The decline is of course a negative number but I have plotted it here in absolute positive values. The Blue line is the Bakken monthly decline in barrels per day. In August the Bakken old wells declined by just under 73,000 barrels per day and that number is increasing, every month, by just over 1,400 barrels per day.
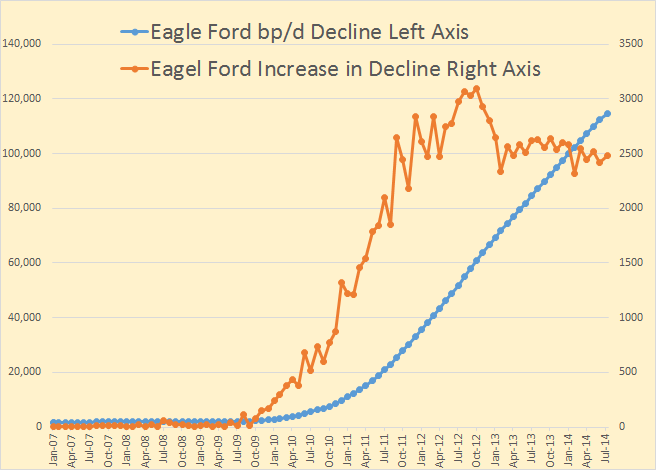
Eagle Ford oil production is declining at 115,000 barrels per day and that decline rate is increasing by about 2,500 barrels per day every month.
The point of this whole exercise is that the Red Queen is having to run a little faster each month just to keep production level. And in the last few months she has been doing a fairly good job of doing that. But that job will get harder and harder each month.
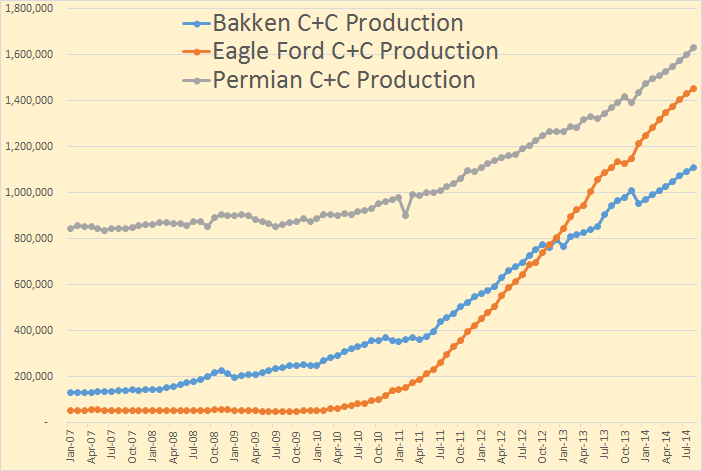
Shale is basically three plays, Baken, Eagle Ford and Permian. Though the Permian is a lot of conventional oil the EIA classifies it all as Shale or Light Tight Oil.
In the Bakken everything after April is just an estimate by the EIA and for Eagle Ford and the Permian the last 12 months they show is an estimate. Their numbers will be revised to the correct number when they finally get the data in.
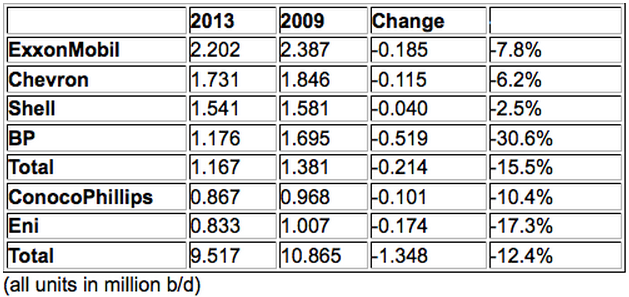
The seven largest publically owned oil companies have all peaked. Their combined production is down 1.248 million barrels per day or 12.4% in the four years from 2009 to 2013. That’s a decline of 3.1% per year. BP seems to have suffered the most, down 30.6%.
3 Comments on "EIA’s Drilling Productivity Report"
rockman on Tue, 15th Jul 2014 6:41 am
Interesting charts but they ultimately focus on Big Oil in the US in the discussion about domestic production. Big Oil became a less important domestic player decades ago when it began focusing on foreign exploration. With the exception of the DW GOM Big Oil isn’t much of a player in the US anymore. At least not with the drill bit: Big Oil’s production decline is more significant than they offer when you take into account their gains from production acquisitions. As an example when ExxonMobil acquired XTO it represented 80%+ of the proved reserve additions they booked that year.
Nony on Tue, 15th Jul 2014 9:38 am
On the Bakken, not only did they have a great May, but Lynn Helms is predicting even stronger growth next 3 months. That play has really outpaced the naysayers. And the bad winter really was weather impact not geology slowing things down.
The flat bpd increase in the decline of EF/Bakken is interesting, but not sure what to make of it. DC has already posted that the decline rate is a function of the population of well ages. That is gradually changing (this effect drives decline rate down), but then also total size of production is going up, this drives decline rate up. (At this point, my head hurts.) Maybe growth in production is linear, which makes growth in decline linear??
The IOC stuff should be in another post (just disconnected topic).
JuanP on Tue, 15th Jul 2014 11:25 am
Nony, I agree that I was scratching my head thinking about the connection between the shale report and that IOC stuff at the end. I also agree that the IOC production decline deserves its own post.