
The EIA’s Short Term Energy Outlook is out. The data is in million barrels per day.
Not much has changed in the EIA’s projection since last month, however their projection for the remainder of this year and next year has increased slightly.
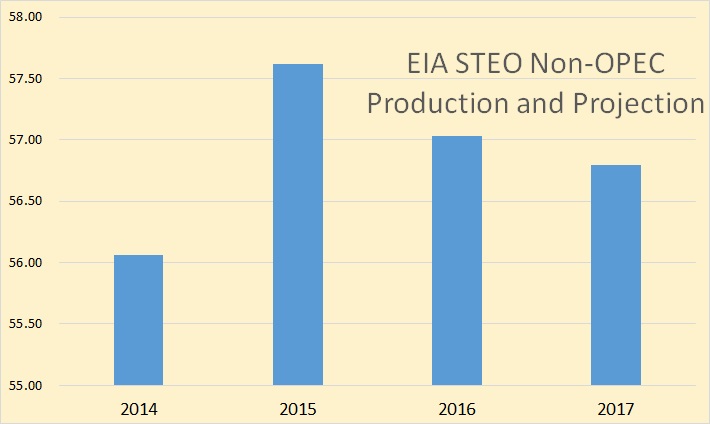
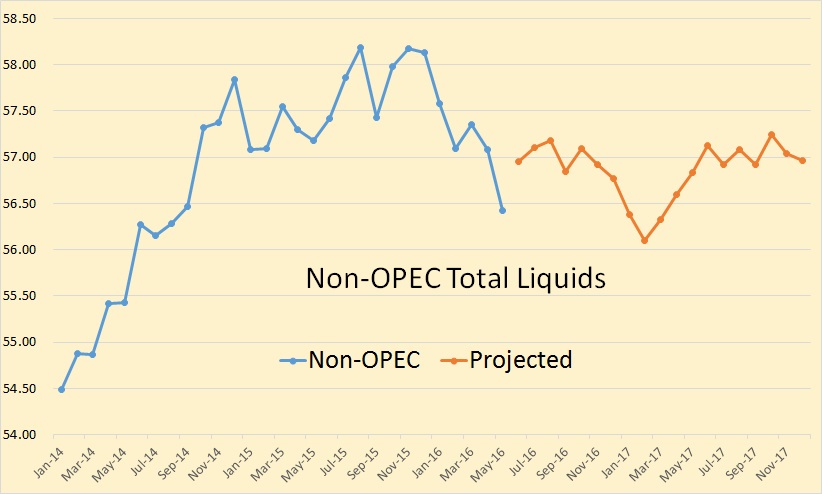
The EIA has Non-OPEC total liquids peaking, so far, in 2015. They have Non-OPEC liquids dropping .58 Mbd in 2016 and another .24 Mbd in 2017.
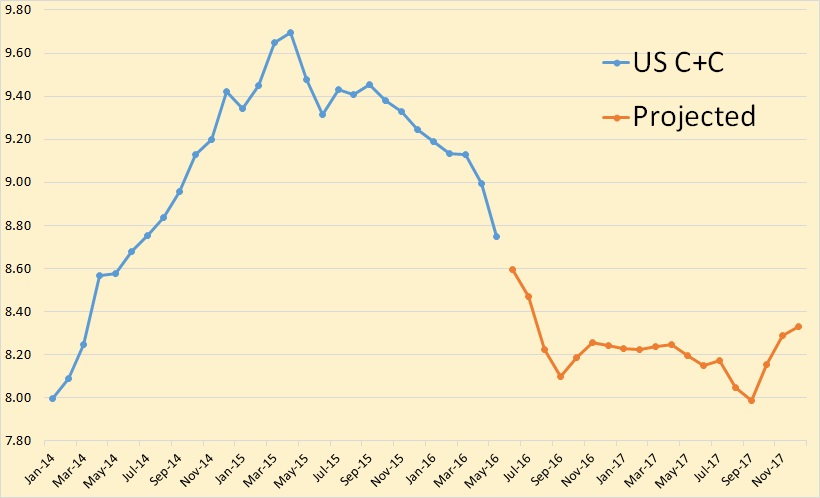
The EIA has US C+C production dropping sharply through August then leveling out for the remainder of the next two years.
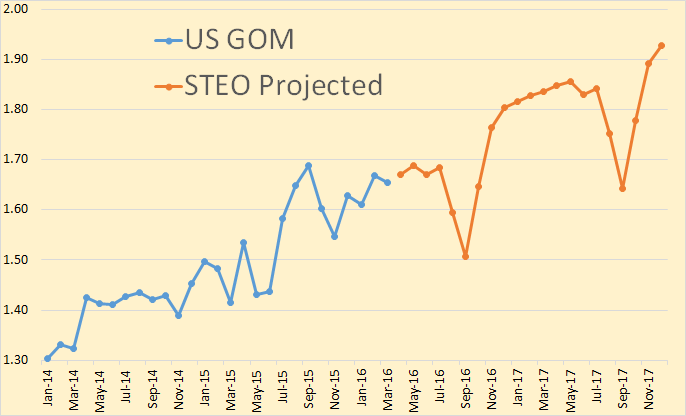
All gain in the next year and a half will come from the Gulf of Mexico, or that is what the EIA expects. The spikes lower in August, September and October are the EIA making their expectations of what the hurricane season will bring.
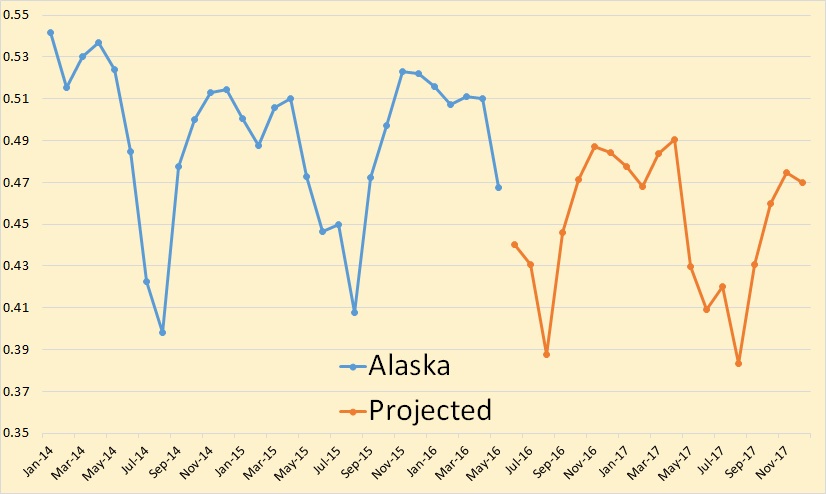
The EIA expects Alaska to continue to decline, though slowly.
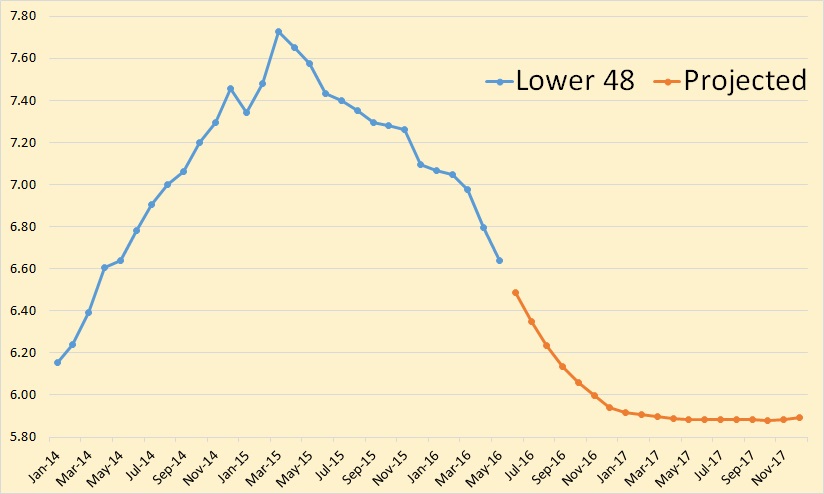
The EIA sees US lower 48 bottoming out around January but no recovery next year.
Canada has released its latest oil production data and outlook: Estimated Production of Canadian Crude Oil and Equivalent. This is “oil and equivalent”. I really don’t know what they mean by “equivalent” but this is 13o thousand barrels per day less than what the EIA has them producing in total liquids. The data is in thousand barrels per day.
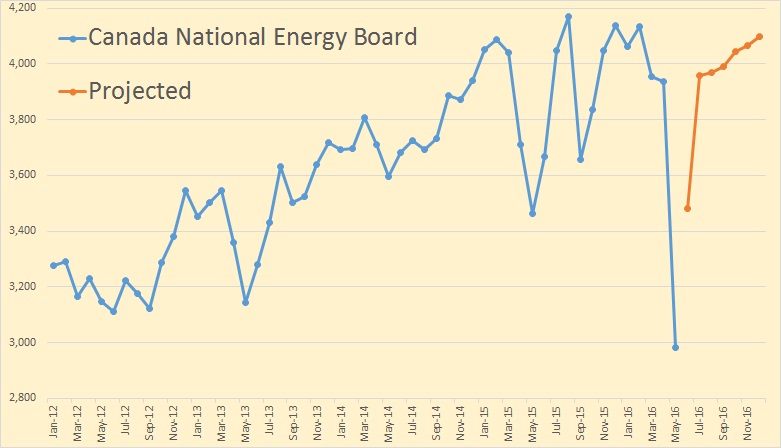
The big drop in May was caused by the massive wildfires in and around Fort McMurray. They expect to be about half recovered in June. But what they have projected for the fourth quarter of 2016 was, to me anyway, a real shocker. They expect to be producing at previous historical highs.
How Bad Is Canada’s Oil Bust? Try the Worst Spending Drop in 70 Years
Overall, oil and gas producers in Canada have cut a whopping $50 billion in capital investments over the past two years. That’s the biggest two-year decline since at least 1947, which is when the Canadian Association of Petroleum Producers started tracking investment spending.
In percentage terms, producers have now cut spending by 62% since it peaked at $81 billion in 2014, with spending in the oil sands being cut in half to just $17 billion. That’s the lowest investment rate for the region since just after the financial crisis.
However, spending in the oil sands region would likely be even lower if it wasn’t for the long lead time of these projects; the bulk of 2016’s investment dollars are being spent on projects that started construction prior to the downturn.
Well hell, if you can cut capex by 62% and continue to produce at record highs, then I say go for it.
The Baker Hughes International Rig Count is out with monthly rig count numbers for May, 2016. This count does not include any FSU countries or inland China.
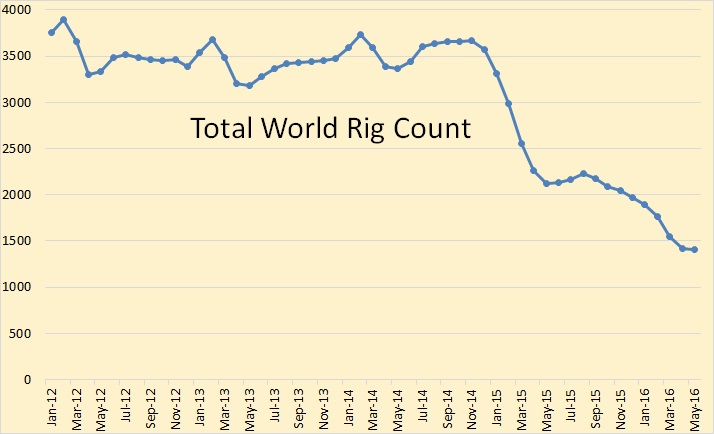
In November 2014 the count stood at 3,570 rigs. Last month the count was 1,405, a drop of 2,165 rigs or 61%.
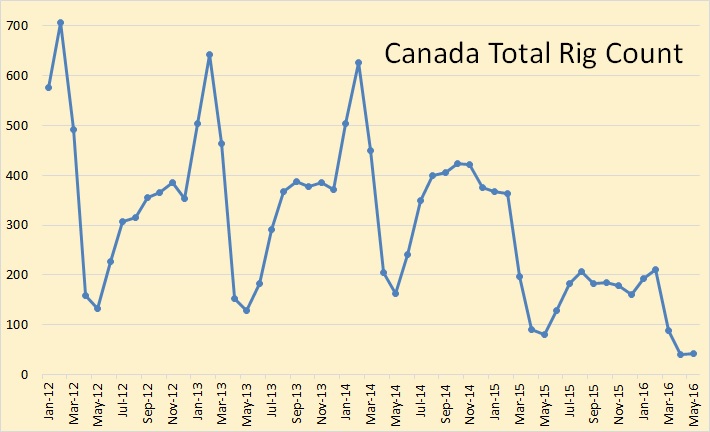 Canada rigs stood at 42 in May, up 1 from April. This is both oil and gas rigs. Canada oil rigs, last week, stood at 13.
If my prediction of 2015 as the year crude oil peaked is to be proven wrong, it looks like those making that claim will have to wait a few years to make their case. I know, there is nothing about OPEC in this report but OPEC is looking pretty shaky right now.
EDIT: I just had to add this. I don’t know how I overlooked it. It is from the same Short Term Energy Outlook linked above. It was constructed from data found in table 3a.
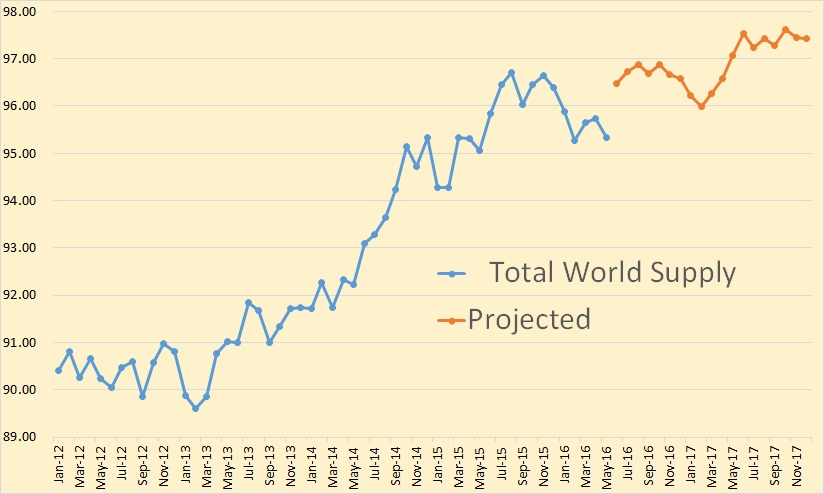
Are you kidding me?
Roger on Tue, 7th Jun 2016 7:07 pm
Denial is a soon-to-be dry river. PO is in the rear view mirror.
The “press” needs to start working on assigning blame to those villains working to keep the wheels on…aka “big oil.”
dave thompson on Tue, 7th Jun 2016 7:23 pm
“Are you kidding me?” Understatement of the new century looking at the last prediction chart.
yoshua on Wed, 8th Jun 2016 4:52 am
It looks like we have reached the top. It wont get better than this.
The good news is that it usually goes faster downhill.
Revi on Wed, 8th Jun 2016 7:31 am
They seem to think it will keep going up, but with the price of oil at $50 or less I don’t think it will happen.
We are at the top of the roller coaster. It will get exciting now, but maybe not in a good way. I hope I don’t scream…..too much…..
Davy on Wed, 8th Jun 2016 11:59 am
“China Oil Imports Drop To Four Month Low As Demand Is Expected To “Moderate Significantly” In 2016”
http://www.zerohedge.com/news/2016-06-08/china-oil-imports-drop-four-month-low-demand-expected-moderate-significantly-2016
“It gets worse; according to an analysis from S&P Global Platts finds China’s apparent oil demand, a measure of domestic production plus net imports, shrank 1.3 percent year-on-year in April. “China’s oil demand growth is expected to moderate significantly in 2016 as gross domestic product growth slows on the back of economic rebalancing,” the emailed report found.”
“What this means is that now that China is fully glutted with both raw and refined product, expect Chinese demand to suddenly drop, something which the latest import data are already showing. Unless of course, the government decides to ram refinery production, and alongside the coal and steel industry, to force the production of gasoline well above implied demand, something which as the chart above shows is already taking place.”
“Assuming some production rationality, however, especially if oil prices continue to rise, and should the supply disruptions get resolved (especially the ongoing situation in Nigeria where the Niger Delta Avengers continue to impair production on a daily basis virtually and mysteriously unopposed), the market is setting itself up for another rerun of the summer of 2015, when prices rose and flatlined for most of the summer, only to tumble into the end of the year.”
JuanP on Wed, 8th Jun 2016 6:28 pm
I can make a forecast that I am 100% certain that is correct. I forecast that this EIA forecast will be wrong as usual. These fuckers couldn’t wipe their own asses with six hands and an instruction manual! LOL!
Kenz300 on Thu, 9th Jun 2016 7:29 am
It is time to divest from fossil fuels………..
It is time for clean energy production with wind and solar and clean energy consumption with electric vehicles.
Electric cars, bicycles and mass transit are the future…..fossil fuel ICE cars are the past…………..
Think teen agers vs your grand father…………………. cell phones vs land lines…….
NO EMISSIONS……..climate change is real………
Save money……no stopping at gas stations…..no oil changes……..less overall maintenance……