
BP has released its Statistical Review of World Energy 2014. There are a lot of things in this report but I am only posting charts on liquid petroleum only. The BP report includes crude oil and NGLs. Their data does not include ethanol or any type of biofuels or process gain. The report actually has data from 1965 but I started all charts from 1990 in order to highlight more recent production. All data is in kb/d.
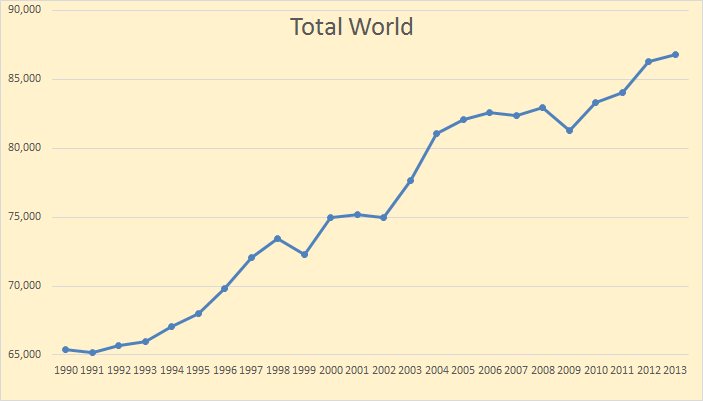
BP has World liquids output up 557 kb/d in 3013.
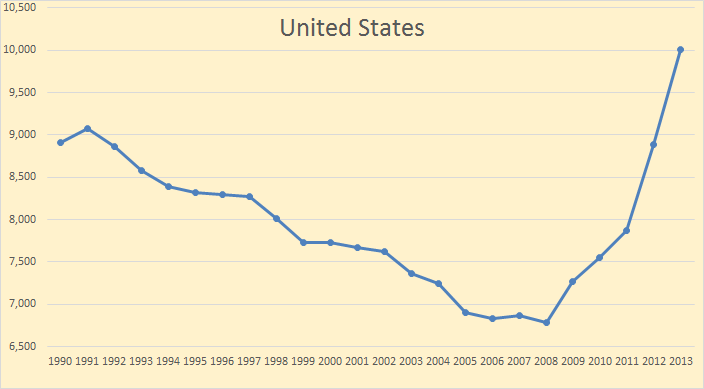
USA liquids were up 1,111 kb/d in 2013.
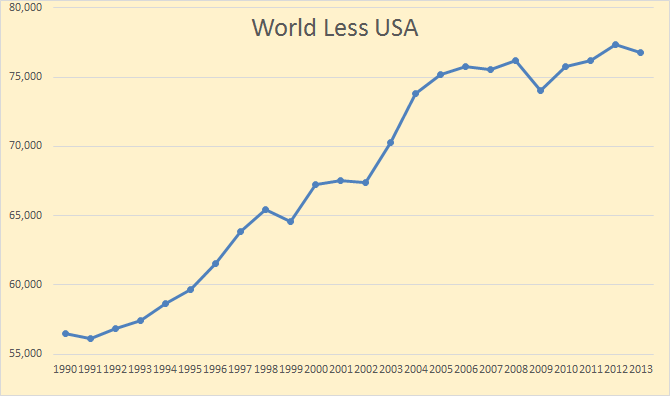
World liquids less USA were down 554 kb/d in 2013.
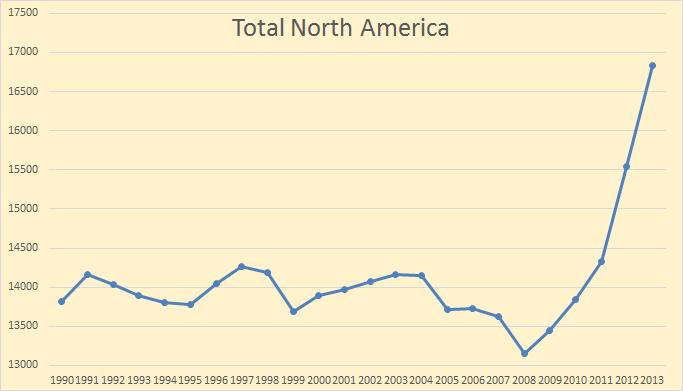
North America is USA plus Canada less Mexico and was up 1,283 kb/d in 2012.
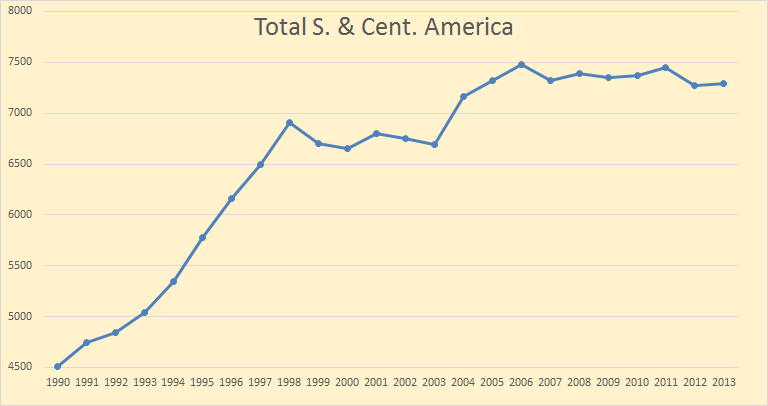
Central and South America was up 19 kb/d but is down 181 kb/d since peaking in 2006.
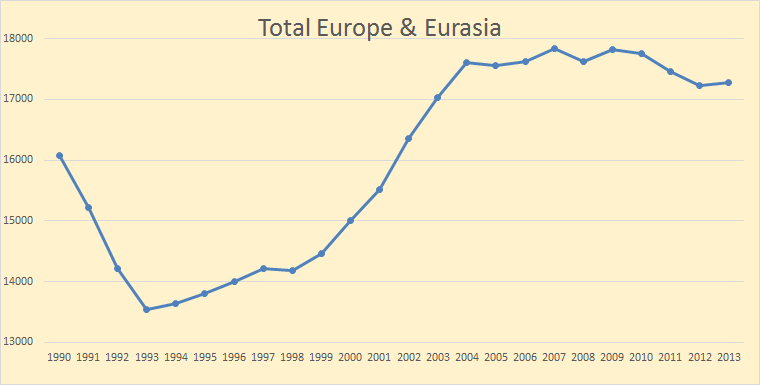
Europe and Eurasia was up 50 kb/d in 2013 but is down 531 kb/d since peaking in 2017.
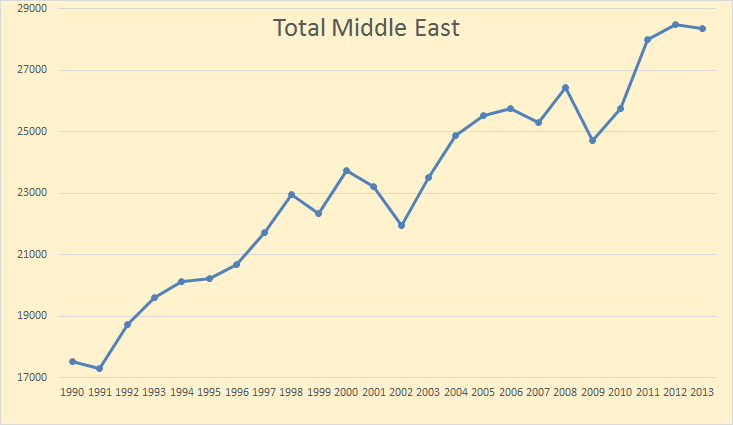
Middle East liquids production was down 126 kb/d in 2013.
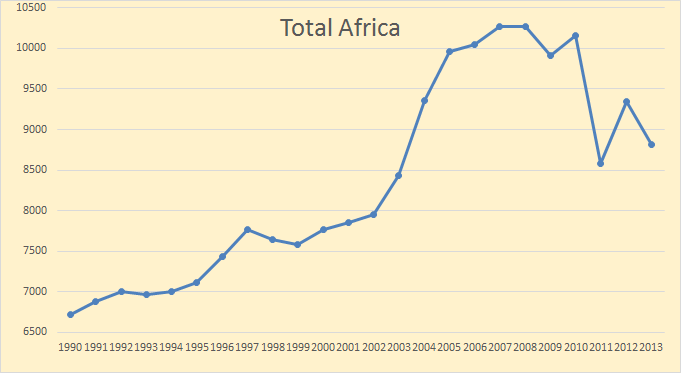
Africa was down 531 kb/d in 2013 and is down 1,457 kb/d since peaking in 2007.
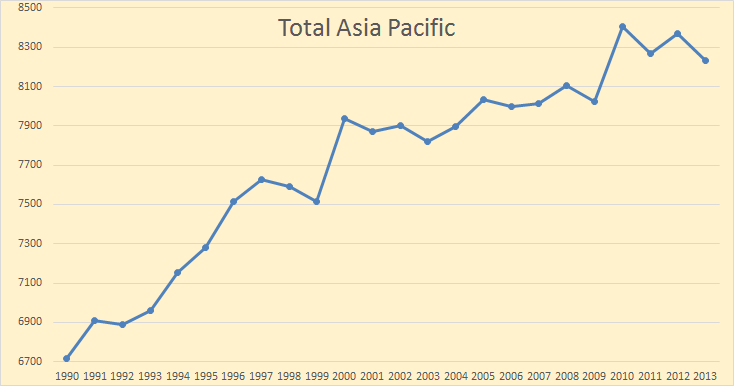
Asia Pacific was down 138 kb/d in 2013 and is down 221 kb/d since the peak in 2010.
Highlights:
World oil production increased by just 560,000 b/d in 2013, less than half the growth of global consumption.
The US (+1.1 million b/d) recorded the largest growth in the world and the largest annual increment in the country’s history for a second consecutive year. The US accounted for nearly all (96%) of the non-OPEC output increase of 1.2 million b/d (the strongest since 2002) to reach a record 50 million b/d. Increases in Canada (+210,000 b/d) and Russia (+150,000 b/d) offset declines in Syria (-120,000 b/d), the UK and Norway (-80,000 b/d each) and Australia (-70,000 b/d). OPEC output fell by 600,000 b/d, the first decline since 2009, driven by a decline of 520,000 b/d in Libya.
TIKIMAN on Tue, 17th Jun 2014 6:27 am
Sounds like this is bad!
Davy, Hermann, MO on Tue, 17th Jun 2014 7:23 am
The ME graph is disturbing and signals the end of BAU. The US graph will be a retirement party by 2020. With the long lead times in this production game we must accept that the dip in the ME where most of the cheap crude is signals a death rattle for global BAU that must have a steady increasing production of “cheaper” crude to maintain the complexity and intensity of the global system. IMA a system with an increasingly dysfunctional and in a disequilibrium position because of stagnating growth and massive debt creation. All this in a background of limits of growth everywhere, diminishing returns on effort to solve the intractable problems everywhere. A world in population and carrying capacity overshoot especially with the all-important variable food. Finally a deteriorating climate and multiple ecosystem in the middle of collapse. It appears the oil production undulating plateau is ready to break. The results of this break will be difficult to forecast and predict because we are dealing with a complex system with “chaos decent” entering the equation. Chaos is random and irrational and a very bad thing for a just-in-time, complex, and interconnected global system that is delocalized and dependent on far flung distribution networks and resource sourcing. The oil industry is a microcosm of this macro situation and will suffer accordingly. This will be self-perpetuating with the loss of confidence affecting capex and production cost via a contracting financial system.
ronpatterson on Tue, 17th Jun 2014 7:32 am
Europe and Eurasia peaked in 2007. The above 2017 is a typo, Sorry.
paulo1 on Tue, 17th Jun 2014 8:26 am
Davy
re: “All this in a background of limits of growth everywhere, diminishing returns on effort to solve the intractable problems everywhere. A world in population and carrying capacity overshoot especially with the all-important variable food.”
I had two children
My daughter has one child…she is 34.
My son has decided not to have children….he is 30.
These kids, (I Call them kids, being 58), decided to do this on their own volition without any propaganda from Dad on limits, etc. I have never said a word to either of them about how to live their lives except for staying out of debt.
Birth rates can decline with education and options. This trend is common.
This site links to other articles on declining pops.
http://truthstreammedia.com/overpopulation-try-declining-birth-rates-in-most-all-developing-countries/
Now, normally I would have hope with this kind of news…then I read about Egypt or watch ISIS rebels executing young fathers and cutting off heads and I wonder how long before someone turns the ME into melted glass? Probably after after oil exports decline would be my guess.
Paulo
Pops on Tue, 17th Jun 2014 8:59 am
BP is being waay to pessimistic, the current reserves will last much longer than 50-something years.
Unfortunately the part where they are wrong is “at current rates of consumption.”
Kenz300 on Tue, 17th Jun 2014 10:08 am
BP once had a slogan – “Beyond Petroleum”
They backed away from that when their leadership last changed.
Soon they will realize that was a mistake. Big oil needs to move beyond being just an oil company and become ENERGY companies.
Investments in alternative energy sources can diversify their business model and make it more sustainable for the long run.
Wind, solar, wave energy, geothermal and second generation biofuels made from algae, cellulose and waste are the future.
Davy, Hermann, MO on Tue, 17th Jun 2014 10:41 am
Paulo, 50’s here. My daughter is 25 living in Madrid. I have told her if she wants kids she better get started. I also have shown her the dangers going forward for all of us and especially for those yet born. She is bought into my message as much as a 25 year old can. My Italian girlfriend (here with a green card) is bought into my message. She grew up in the Dolomites living close to the land. Yet, neither wants to live the life of a doomer so they do have blocking mechanisms to cope. I am prepping on my families behalf more or less alone. I accept this because it takes a different mentality to live collapse. I am glad my family is at least accepting the message as one would accept a climate change documentary or something then go ones daily routine. I am living collapse now because I see it with my mentality. We “Are” in collapse, paradigm shift, and the end of the world as we know it. I watch with surreal amazement at BAU comings and goings. It is sometimes like a slow motion film with an amazing unfolding. If everyone would have my mentality BAU would fall apart so I am glad I am a low percentage of the population. I do hope BAU takes a bad hit soon because no change has ever happened at the top until a strong crisis hits. The longer this is put off the more disequilibrium is building in the system and the worse the blow off will be. This is much like a volcano not venting.
shortonoil on Tue, 17th Jun 2014 10:42 am
The above graphs are certainly not going to install confidence in the every thing is wonderful theme put out by the MSM. Europe is already a basket case, and the US falls deeper into debt every day. But the situation is actually much worse than the graphs portrait. The graphs show gross volume produced, or accordingly gross energy. They do not inform us about what is the energy that was really delivered to the economy, and energy is money. They do not take into consideration the amount of energy it took to produce these liquids. When that factor is taken into consideration, things are not just looking bad, they are looking critical.
The energy to produce hydrocarbons is constantly increasing, and it is increasing faster than the production is falling. The hyperbole associated with trying to play games with the Laws of Physics will have its consequences. A dose of reality is in store for Western industrial civilization!
http://www.thehillsgroup.org/
Davy, Hermann, MO on Tue, 17th Jun 2014 10:48 am
Short I am glad you keep this point front and center because it is like looking at the Jones-es down the street with the great house, fancy cars, and big parties but in reality they are mortgaged to the hilt. The wife is cheating on the alcoholic husband and the kids are into drugs. Appearances are deceptive. Statistics are great tools of deception.
Dave Thompson on Tue, 17th Jun 2014 12:11 pm
Sad to hear these days when people insist that, we need to go to alternate fuels,like wind, solar, wave energy, geothermal and second generation biofuels made from algae, cellulose and waste are the future. All of the above listed do not exist without fossil fuel inputs and none of them can ever hope to replace liquid fossil fuels for transportation and BAU.
J-Gav on Tue, 17th Jun 2014 12:18 pm
And the shell game goes on …
Nick Robin on Tue, 17th Jun 2014 7:51 pm
Please read the details.
There is a line in Oil Consumption Chart
“Inland demand plus international aviation and marine bunkers and refinery fuel and loss. Consumption of biogasoline (such as ethanol), biodiesel and derivatives of coal and natural gas are also included.”
Also in Coal Consumption, there is a note like this
“Excludes coal converted to liquid or gaseous fuels, but includes coal consumed in transformation processes.”
So whatever Coal is used for producing Natgas or Liquid fuels is added in Oil category to show as though more Oil is consumed.
Ideally this should be included only in Coal category or both Coal and Oil.
Joe Wilson on Tue, 17th Jun 2014 7:59 pm
2012 Coal Consumption is shown as 3862.1759228316, while 2013 is shown as 3881.4313806123 and its shown as 0.8% increase. Actually its only a 0.49% increase. A 0.8% will translate to 2013 consumption of 3893.07.
We don’t know whether this is mistake or cooking the #.
John Gav on Tue, 17th Jun 2014 9:39 pm
BP Report does include Ethanol & Biodiesel in Oil Consumption. This is unfair.