Peak Oil is You

Donate Bitcoins ;-) or Paypal :-)
Page added on October 23, 2013
Bakken, Eagle Ford, New EIA Data

The EIA has just began posting data on the six major tight oil and gas production areas, Bakken, Eagle Ford, Haynesville, Marcellas, Niobrara and Permian. All this data can be found at: EIA Drilling Productivity Report.
To the right of the chart you will see several PDF links. Ignore all of them except the last one: Full Report. That is simply all the above links combined into one.
Then if you would like the data in Excel format click on: Report data (aggregated by region) That link will download all the data in the PDF charts in an Excel Spreadsheet.
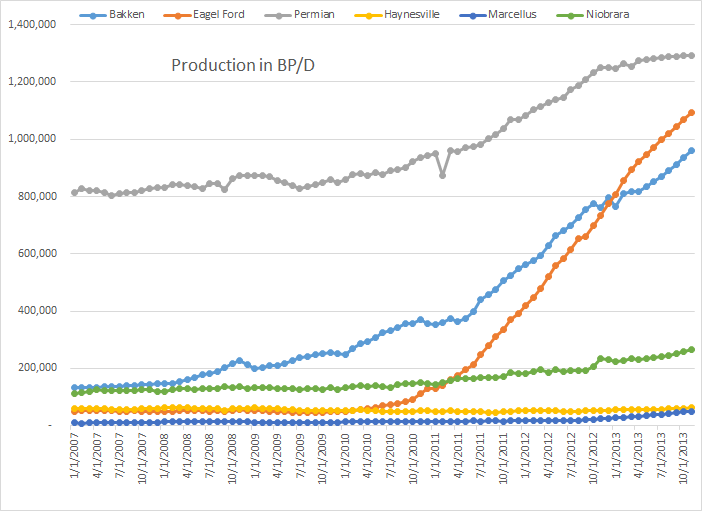
And from this data you can create Excel Charts as I have done below. The first chart is production in barrels per day from each of the six oil and gas producing regions. Oil is my main concern, not gas, but others may find the gas data just as interesting.
Of note: We finally have production data and decline rate data on Eagle Ford. We also have Permian data, which produces more oil than either the Bakken or Eagle Ford but the Permian has peaked or nearly so. It is still increasing by about 1 kb/d but each rig is only producing 79 new barrels per month and that just barely keeps up with declines. New Production is estimated to be 35 kb/d in November and declines are expected to be 34 kb/d. for a gain of about 1 kb/d.
Also the EIA says this data is through September with Estimates for October and November. And also of note is the fact that the EIA’s data does not match the North Dakota data for the Bakken. A few months it is lower than the ND data but usually it is a lot higher. Some months it is over 90,000 bp/d higher than the Bakken and 30,000 bp/d higher than all North Dakota. The EIA says it is Bakken Data but I suspect it could be all North Dakota data. Anyway the first chart, production.
Eagle Ford has surpassed the Bakken in oil production. But Eagle ford is fast approaching the Red Queen stage. The Chart below is decline rates of all old wells. The data does not include new wells brought on line in the latest month,
The Bakken is declining by 60,000 barrels per day. That is an increase of 16,288 barrels per day over what they were declining by last November. Their decline rate increased by over 37 percent in the past year. But Eagle Ford did even worse. Their decline rate is almost 81,000 barrels per day an increase of 26,719 barrels per day or almost 50 percent over the last year. Only Niobrara’s decline rate is increasing faster. Their decline rate increased by over 55 percent over the last year.
What this means of course is that right now the Bakken’s rigs must produce an increase of 60,000 barrels per day just to break even. In November the EIA estimates that their increase will be 86,000 bp/d for a net increase of 26,000 bp/d. And Eagle Ford is declining at 81,000 barrels per day. The EIA estimates that their new wells will show an increase of 105,000 bp/d for a net increase of 24,000 bp/d.
What this means is that if the decline rate continues at the same percentage rate, then in one year the Bakken will need to increase production by 82,500 barrels per day just to break even and Eagle Ford would need to increase production by 120,600 barrels per day just to stay even. That is the That is about what the Bakken is producing today and a little more than Eagle Ford is producing. This means that Eagle Ford will peak, or reach the Red Queen stage in the second half of next year and the Bakken soon thereafter, in the first half of 2015.
And I don’t know if this means a lot but some of the data is labeled “per rig” not “per well”.
And if anyone would like to be put on my list of people to notify when a new post comes on line, or to be removed from that list, please notify me at DarwinianOne@gmail.com
7 Comments on "Bakken, Eagle Ford, New EIA Data"
mike on Wed, 23rd Oct 2013 8:07 pm
well would you look at that. Maths fucking up reality again!
BillT on Thu, 24th Oct 2013 3:14 am
The faster they run, the be-hinder they get! Fail coming up! LMAO
rollin on Thu, 24th Oct 2013 4:29 am
Don’t worry, new computer technology and three-D printing will solve the problem shortly. 😉
rockman on Thu, 24th Oct 2013 2:08 pm
“Maths fucking up reality again!” Actually not. All the trends are following the same path all previous similar reservoirs have followed since the beginning of the oil age. The fact that some ignored this well established precedence is another matter. And they didn’t have to go back too far to see it: the fractured Austin Chalk reservoir was the hottest oil play on the planet when it was horizontally drilled and frac’d in the 90’s. The current plays are following that model. The only thing new these days is $100 oil.
Poordogabone on Thu, 24th Oct 2013 5:06 pm
“This means that Eagle Ford will peak, or reach the Red Queen stage in the second half of next year and the Bakken soon thereafter, in the first half of 2015.”
This will be a sobering landmark event that will end the cornucopian dream.
It could come sooner depending on the price of oil. If things slow down in China and doesn’t improve elsewhere we could get lower oil prices incompatible with some production from these plays.
foxv on Thu, 24th Oct 2013 5:26 pm
“This will be a sobering landmark event that will end the cornucopian dream.”
Imagine what the price of oil will do then. All this pie in the sky production claims have only kept oil at $100/brl in a growing inventory environment.
A glaringly obvious peak in world’s future saviour? 2014 may turn in to one hell of a year.
rollin on Thu, 24th Oct 2013 6:34 pm
I would say that oil crews will be doing more fracks per well, more wells from a given site and reducing the distance between wells. Then the increase in new wells drilled will not have to be as great to bring production higher.
Still shoveling against the tide though, the inevitable result will only be delayed and steepened.
What is next is the question? The Atlantic coast? Actual reduction in use through conservation and efficiency? More imports? Natural gas conversions? All of the above?