Peak Oil is You

Donate Bitcoins ;-) or Paypal :-)
Page added on May 13, 2015
Bakken Data + Short Term Energy Outlook

North Dakota has published their Bakken Production Data as well as North Dakota Production Data.
North Dakota production was up 12,501 bpd above February but still stands 37,531 bpd below the December high and is still 789 bpd below the January production numbers.
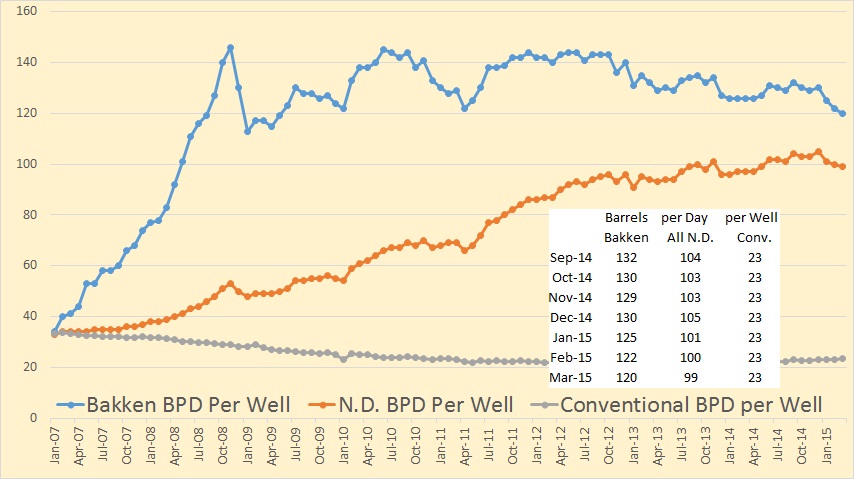
Barrels per day per well is dropping, 12o for Bakken wells, 99 forN.D. Total and 23 for Conventional wells.
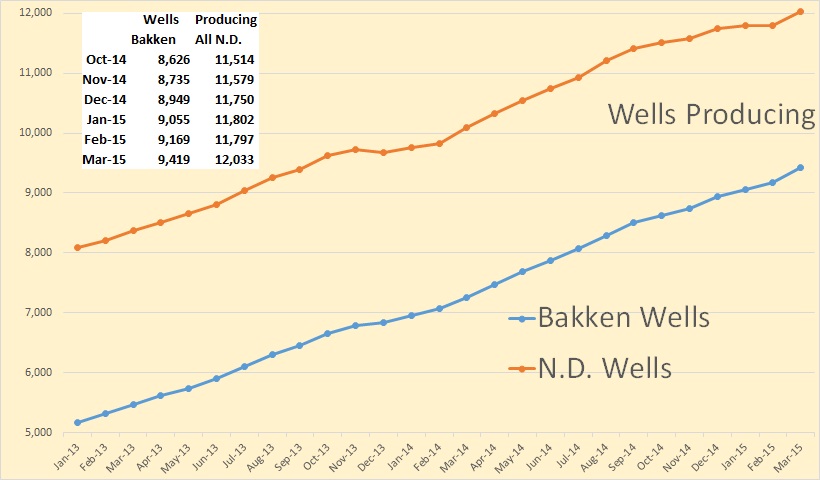
According to the NDIC stats the number of wells actually producing in the Bakken increased by 250 in March and total North Dakota wells increased by 236. Which means some non-Bakken wells were shut down. Lynn Helms said, in the Director’s cut, that the increase was 240 producing wells though his totals were different.
From the Director’s Cut:
Feb Producing Wells = 12,199
Mar Producing Wells = 12,439 (preliminary)(NEW all-time high)
9,397 wells or 76% are now unconventional Bakken – Three forks wells
3,037 wells or 24% produce from legacy conventional pools
Feb Permitting: 197 drilling and 0 seismic
Mar Permitting: 190 drilling and 0 seismic
Apr Permitting: 168 drilling and 1 seismic (all time high was 370 in 10/2012)
Feb Sweet Crude Price = $34.11/barrel
Mar Sweet Crude Price = $31.47/barrel
Apr Sweet Crude Price = $38.33/barrel
Today Sweet Crude Price = $46.00/barrel (all-time high was $136.29 7/3/2008)
Feb rig count 133
Mar rig count 108
Apr rig count 91
Today’s rig count is 83 (lowest since January 2010)(all-time high was 218 on 5/29/2012)
The statewide rig count is down 62% from the high and in the five most active counties rig count is down as follows:
Divide -77% (high was 3/2013)
Dunn -74% (high was 6/2012)
McKenzie -52% (high was 1/2014)
Mountrail -63% (high was 6/2011)
Williams -63% (high was 10/2014)
Comments:
The drilling rig count dropped 25 from February to March, 17 more from March to April, and has since fallen 8 more from April to today. The number of well completions2 rose sharply from 42(final) in February to 189(preliminary) in March. Oil price is by far the biggest driver of the slow-down followed by oil extraction tax triggers, NDIC gas capture goals, and NDIC oil conditioning rules. There were no major precipitation events, 8 days with wind speeds in excess of 35 mph (too high for completion work), and 1 day with temperatures below -10F.
Over 99% of drilling now targets the Bakken and Three Forks formations.
At the end of March there were an estimated 880 wells waiting on completion services, a decrease of 20. To maintain production near 1.2 million barrels per day, 110-120 completions must be made per month.
I bolded that last line because I flat don’t believe it. If they had 240 additional wells in March and production increased by only 12,500 barrels per day it will take one hell of a lot more new wells than 110 to 120 to keep production flat. Of course there is a difference between additional “wells producing” and “new wells completed” but that should make little difference. Old low or non producing wells are shut in so the number of “new wells” should be larger than additional “wells producing”, in most cases that is.
The EIA’s Short Term Energy Outlook just came out. All the data is “Total Liquids” and is in million barrels per day.
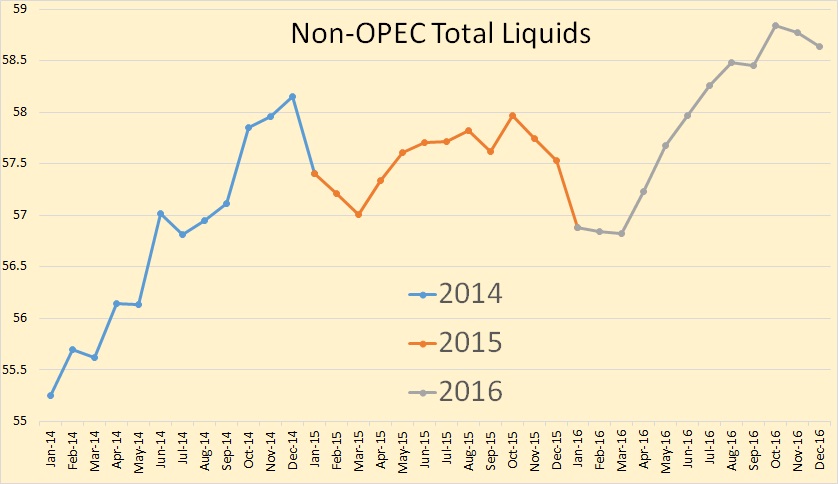
The EIA is actually expecting total liquids to decline from the high of the last three months of 2014, though the annual average would still be .83 million barrels per day higher. However they are expecting things to really take off again in 2016.
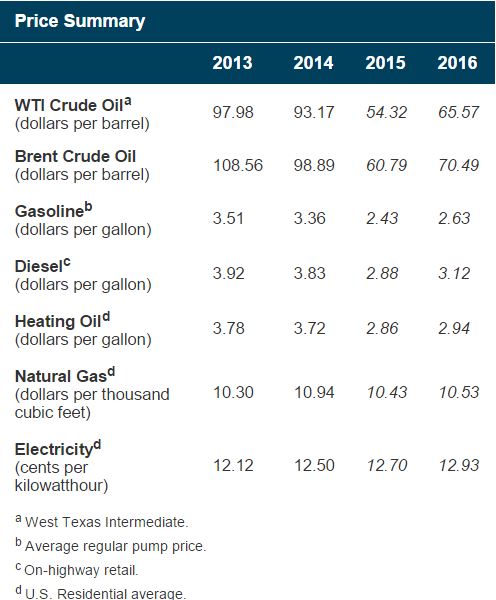
They are predicting WTI prices to average $65.57 next year. That is not enough, in my opinion, to allow a shale recovery. So I really don’t understand their reasoning.
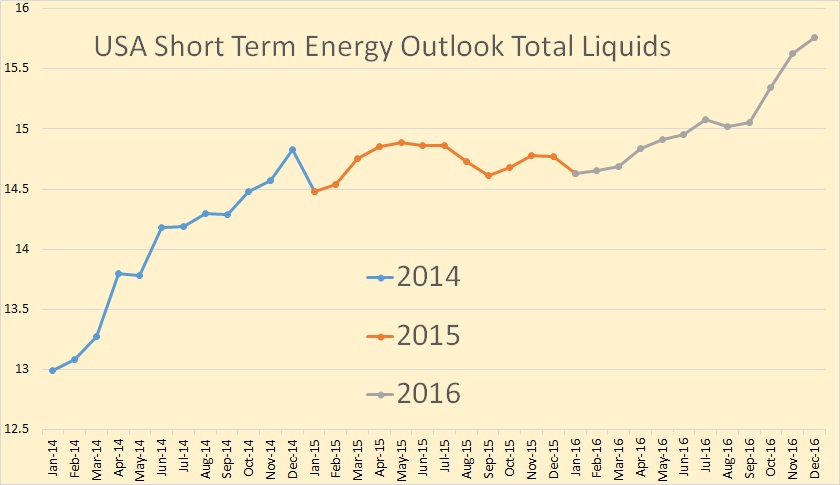
Looks like they are not expecting much of a production increase foe the US in 2015, closing the year below the December 2014 level. But they expect things to take off late in 2016. This is rather strange in view or their price prediction for 2016.
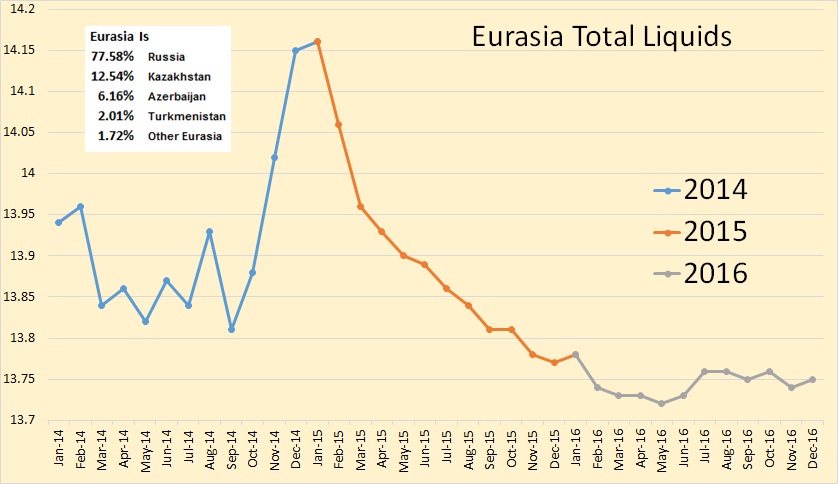
The only other really interesting prediction they had was Eurasia. They expect Eurasia to peak in January 2015 and decline pretty fast from that point on. Obviously they are not expecting Kashagan, Kazakhstan’s giant but troubled field, to come on line before 2017.
The decline is exaggerated here on this non-zero chart. From peak to valley is really only about 3% of total production. But nevertheless 3% is quite a lot from such a large producing area.
11 Comments on "Bakken Data + Short Term Energy Outlook"
Nony on Wed, 13th May 2015 7:45 pm
Ron is messing up two ways,
*completions in March only produce on average for half the month.
*Looking at a single month is not representative given variations.
———-
Dennis and several others have done good calculations (and posted them at POB) to demonstrate that ~120 gives you equilibrium.
Ron has a tendancy to make way to much soup from one onion and to jump to conclusions always in the peaker direction.
forbin on Thu, 14th May 2015 5:25 am
odd really
since January the price of Brent has increased from $48 per barrel to todays price of $67
a 40% increase in price
at any other time this would have been a remarkable event for a 4 1/2 month period …..
Forbin
nony on Thu, 14th May 2015 11:09 am
About half of it is no surprise. Was already in the futures curves. Just working off a glut to come to equilibrium. The rig count and completion count went down faster than predicted in Jan also. Mo
GregT on Thu, 14th May 2015 12:39 pm
“Ron is messing up two ways,”
Instead of hiding over here at PO.com, why not leave a message for Ron in person?
GregT on Thu, 14th May 2015 12:50 pm
I can the see the debate somewhere along the following lines:
Ron: 2000 word essay complete with charts, graphs, statistics, a summary, and a conclusion.
Nony: You are messing up in two ways
Ron: No response
Nony: LOLOL This is hilarious
Davy on Thu, 14th May 2015 12:55 pm
Greg, come on he is the wonder number boy. He can do anything even fly like a pig.
GregT on Thu, 14th May 2015 1:06 pm
https://www.youtube.com/watch?v=714-Ioa4XQw
Nony on Thu, 14th May 2015 4:18 pm
I was permabanned for trolling at POB.
GregT on Thu, 14th May 2015 4:44 pm
Not surprising. Is continuing to do the same here actually making you feel better about yourself Nony?
Nony on Thu, 14th May 2015 4:52 pm
No.
Davy on Thu, 14th May 2015 5:14 pm
Wonder Boy, give those other uptight sites Hell. We are not afraid of the corn porn here. In any case we outnumber the corns significantly. There is a reason for that and it is called reality checking. Notice how Captain Marm has disappeared. He couldn’t take it anymore. Wonder boy has gonades!