Peak Oil is You

Donate Bitcoins ;-) or Paypal :-)
Page added on November 14, 2015
Bakken Big Decline in September

The NDIC has published their monthly update for Bakken Oil Productin and all North Dakota Oil Production.
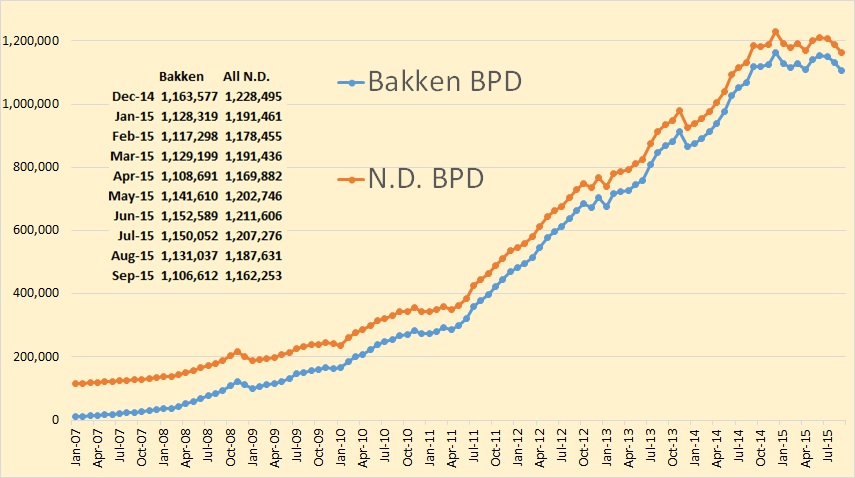
Bakken production was down 24,424 barrels per day while all North Dakota was down 25,378 bpd.

Here is an amplified version of the last 15 months of North Dakota production. September 2015 production is now below September 2014 production so the 12 month average has now turned negative.
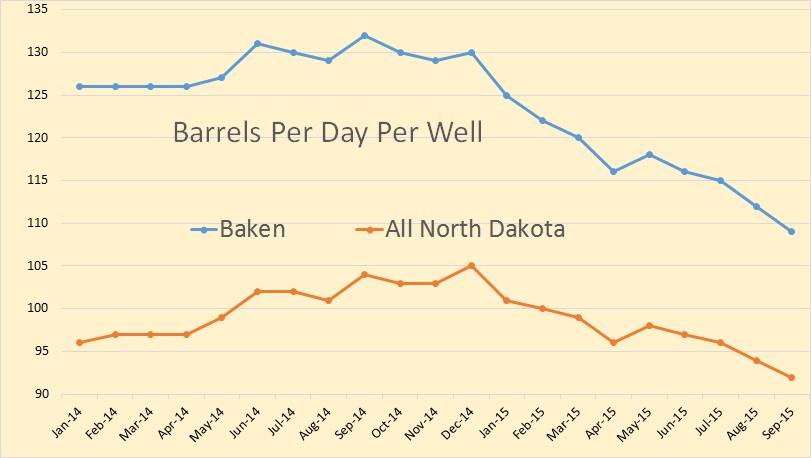
Even though producing rigs in North Dakota declined in September, barrels per day per well declined also from 94 to 92. Bakken bpd per well declined from 112 to 109.
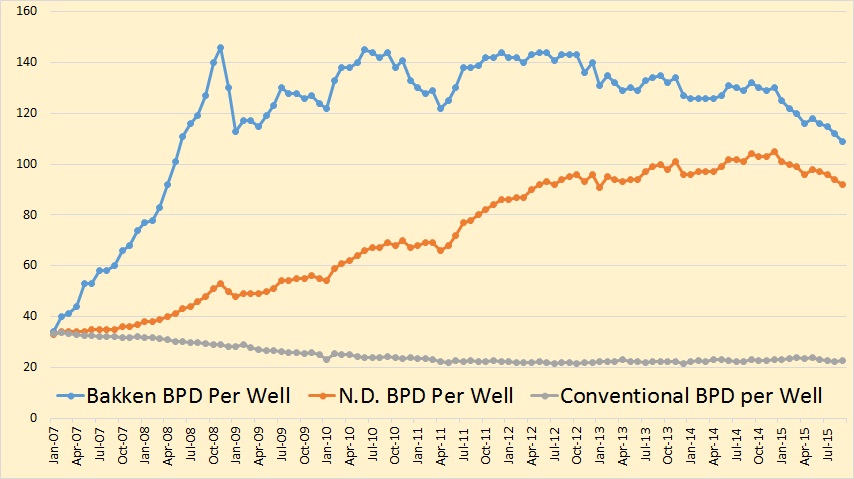
This is a long term view of Bakken and North Dakota barrels per well.
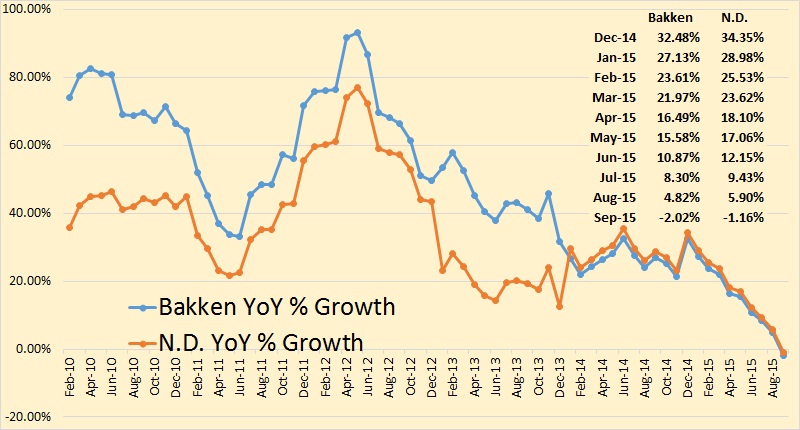
Bakken year over year percent growth has finally gone negative.
From the Director’s Cut, bold mine.
August Producing Wells = 13,031
September Producing Wells = 13,025
10,228 wells or 78% are now unconventional Bakken – Three forks wells
2,797 wells or 22% produce from legacy conventional pools
August Sweet Crude Price1 = $29.52/barrel
September Sweet Crude Price = $31.17/barrel
October Sweet Crude Price = $34.37/barrel
Today’s Sweet Crude Price = $31.25/barrel
August rig count 74
September rig count 71
October rig count 68
Today’s rig count is 64
Comments:
The drilling rig count decreased 3 from August to September, decreased 3 from September to October, and dropped 4 more so far this month. Operators are now committed to running fewer rigs, but drill times and efficiencies continue to improve while oil prices continue to fall. This has resulted in a current active drilling rig count of 12 to 15 rigs below what operators indicated would be their 2015 average if oil price remained below $65/barrel. The number of well completions rose slightly from 115(final) in August to 123(preliminary) in September. Oil price weakness is now anticipated to last through next year and is the main reason for the continued slow-down. There was one significant precipitation event in the Williston area and one in the Minot area, 5 days with wind speeds in excess of 35 mph (too high for completion work), and no days with temperatures below -10F.
Over 98% of drilling now targets the Bakken and Three Forks formations.
At the end of September there were an estimated 1,091 wells waiting on completion services, 98 more than at the end of August.
Helms’ comments about the number of wells producing is interesting. He has North Dakota producing wells declining by 6, from 13,035 to 13,031. However the stats, from my links up top, has Bakken producing wells increasing by 46, from 10,114 to 10,160. But of course Helms is talking about total all North Dakota wells. The North Dakota stats said producing wells numbered 12,630 in September, down from 12,651 in August, a decline f 21 producing wells. This means that at least 67 non-Bakken wells had to be shut down during the month.
But it had to be a lot more than that. If 123 wells were completed, 98% of them in the Bakken, but Bakken producing wells increased by only 46, then a lot of Bakken wells had to be shut down as well. In fact if 123 wells were completed yet the number of producing wells fell, either by 6 as Helms said or by 21 as the NDIC stats indicate, then somewhere between 129 and 144 producing wells had to be shut in.
But more importantly some of Helms’ numbers just don’t make any sense. Wells awaiting completion increased by 98. That means 98 more wells were drilled than were completed and 123 wells were completed. So for those numbers to be correct then 221 wells had to be drilled. Average rig count during September was 68. So each rig had to drill 3.25 wells during the month or one well every 9.23 days. I just don’t believe it.
Based on the latest data from the NDIC, I updated several charts. As always, I am grateful to the data quality and availability that the NDIC provides.
The following chart shows the amount of oil produced by wells starting in different years. Wells in ND that started before 2015 are together producing 800 kbo/d in September.
The following chart shows the amount of oil, gas and water produced each month. It also shows the Gas/Oil ratio (GOR), and Water/Oil ratio (WOR). The latter ratios seem to have somewhat stabilized recently.
The following chart shows the average cumulative production from all wells in ND, by starting year and by months since the peak month. Wells starting in 2015 are tracking those starting a year earlier remarkably well. This is in contrast with a remark by Helms that wells in May are 25% better than a year earlier. Over time, it looks to me that the % difference in cumulative production from recent wells with wells from 2010/2011 will be very small.
The following chart shows the same data, but now in daily production, and not cumulatively. Unlike in the above chart, I didn’t cut any data at the end of the tails, despite them having fewer data points. So expect those tails to wiggle as more wells continue through their life cycle. Especially the drop at the end of the 2008/2009 tails may not reflect the average of those years. It does show to me however that an endless (40-50 year) continuous tail may be overly optimistic.
In the following graph we can see the average daily production for new wells, for the full calendar month (as no accurate information is available regarding the number of producing days). The blue line shows the average production during the 1st month of production, while the green line shows the average production during the first 3 months of production. This graph shows more clearly that 2014 wells produce initially a bit more than 2013 wells, but from 2014 onwards there has been no significant improvement any further. I still can’t detect any effect of high grading in 2015. I think the likely explanation for that is that operators have always focussed on their best area’s, not just recently.
The following chart shows the new number of well spuds (red), and wells starting production (green), per month. The yellow line tracks the wells that are spudded, but not yet producing. The strange thing is that this number is lower than the estimated number of wells waiting for completion by Lynn Helms.
This can never be the case, as the drilling itself also takes time. I expect that Helms’ estimation is quite wrong, as my calculation is based on the status of all individual wells, while his is some kind of estimation based on a 5 year average.
In blue I show the fraclog/DUCs according to my definition: the wells spud and not yet producing for 5 months. The reason is that it is quite typical for wells to wait 3-5 months before they are completed, so it would be wrong in my opinion to put a well directly after drilling in the DUC category. This blue line represents my best guess of the excess wells that are not being completed, above a standard level of working inventory. The reasons why they are not being completed can vary. I suspect many of them may just not be economical to be completed at the moment, but at least some of them are held off from completion as the operators have enough cash flow, and expect better oil prices in the future.
Most production in ND comes from the Middle Bakken and Three Forks formations. Middle Bakken wells produce on average about 15% more than Three Forks wells (which makes them in my opinion economically much more attractive). However, production from the Middle Bakken is declining now faster on a % basis. The reason for this is that ever fewer Middle Bakken wells are being drilled. I suspect that this is because the sweet spots for Middle Bakken wells is running out, and I think that this is the biggest story of the dynamics of oil production in ND. The following 2 charts demonstrate this.
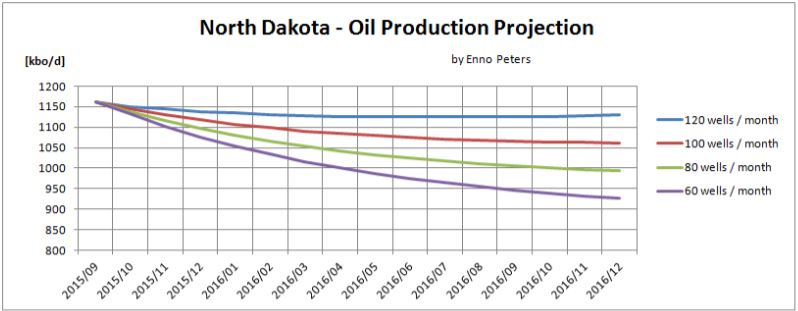
Three months ago, I showed a projection of ND production, and I said: “Therefore, I think the most likely projection is between the green and blue line, at least for the coming 6 months, which means that by year end ND should produce between 1.1 and 1.2 mb/d”.
So far I have the impression that this will turn out to be the case. In March 2016, I forecast that the whole of ND produces between 1.0 and 1.15 mb/d. This is lower than Helms himself predicted (1.2 mb/d until the end of 2016), but somewhat higher than other forecasts I have seen. The oil price, operator’s access to cash, and the quality of the fraclog are the big unknowns.
The following chart shows a projection of oil production in ND based on different numbers of wells being brought online per month, assuming that legacy decline and well quality doesn’t change much (as it hasn’t in the past).
11 Comments on "Bakken Big Decline in September"
buddavis on Sat, 14th Nov 2015 9:26 am
“I still can’t detect any effect of high grading in 2015. I think the likely explanation for that is that operators have always focussed on their best area’s, not just recently.”
May be the most accurate statement I have read on the internet regarding producers, production and development.
Nony on Sat, 14th Nov 2015 12:25 pm
Excellent post by Ron, especially the Enno sections.
The lack of high grading is still curious. Yes, the companies concentrated on their best wells previously. But completions have halved. So, the average should have moved up just by eliminating the less promising half of the projects.
Toolpush is sort of spinning (at the other site) in a self-reinforcing conspiracy view that the wells were open choked. He asserted it a long time ago but has no backup. The much simpler explanation is that drilling moved to deeper parts of the formation. Drilling Info will give you the rig locations in summer 2015 and summer 2014. Clearly there was a collapse into the center, deeper part of the Bakken. (Or just the elimination of drilling in the shallow areas and rigs remaining in the deep ones..but still the average well is now drilling deep.) The deeper area has more gas and less water. The water, gas, oil ratios match what is expected based on the rig locations.
rockman on Sat, 14th Nov 2015 12:56 pm
Bud – “May be the most accurate statement I have read on the internet regarding producers, production and development.” Oh hell no! That statement isn’t correct. The oil patch always choses to drill the less prospective wells first. If we didn’t it would generate too much profit and the next thing you know the govt would start that bullsh*t “excess profit tax” chatter. LOL.
One great aspect of the heritage chart is that you can make a fair guess that now the drilling boom has died the Bakken production might level out around 600k to 700k bopd for some years. But not the Eagle Ford Shale. Those wells don’t have the long production tails that Bakken wells have.
bs on Sat, 14th Nov 2015 1:22 pm
That Director’s cut is a hoot…
My definition of wells completed is:
#Producing Wells Completed + #Confidential Wells Plugged or Producing
from the NDIC daily activity reports.
Recent results are:
may2015 142
june2015 133
july2015 127
aug2015 125
sept2015 113
oct2015 81
So far in Nov, 26 wells have been completed. If the mean/day holds up, 58 wells will be completed in Nov. There are currently 64 active rigs. Coincidence, or capex? Who knows. However, the 1091 estimate for DUCs is a big stretch.
My model (The BS model) agrees closely with Enno’s results and the 2.5%/month depletion rate is also in agreement. My BS confidence level is on the rise!
BobInget on Sat, 14th Nov 2015 2:50 pm
http://www.wsj.com/articles/south-texas-experiences-deepest-oil-production-cuts-1446256188
BobInget on Sat, 14th Nov 2015 2:57 pm
It appears the West will go after IS oil fields. At last!
Combine this with a Hezbollah threat to ‘go after’ Sunni militants, post Beirut and Iraqi bombings for ‘here comes Donnybrook’.
Re: Not so off topic: Saudi Arabia
This just in: NYT 11/13
ERBIL, Iraq — The United States and its allies have sharply increased their airstrikes against the sprawling oil fields that the Islamic State controls in eastern Syria in an effort to disrupt one of the terrorist group’s main sources of revenue, American officials said this week.
For months, the United States has been frustrated by the Islamic State’s ability to keep producing and exporting oil — what Defense Secretary Ashton B. Carter recently called “a critical pillar of the financial infrastructure” of the group — which generates about $40 million a month, or nearly $500 million a year, according to Treasury Department estimates.
While the American-led air campaign has conducted periodic airstrikes against oil refineries and other production facilities in eastern Syria that the group controls, the organization’s engineers have been able to quickly repair damage, and keep the oil flowing, American officials said. The Obama administration has also balked at attacking the Islamic State’s fleet of tanker trucks — its main distribution network — fearing civilian casualties.
But now the administration has decided to increase the attacks and focus on inflicting damage that takes longer to fix or requires specially ordered parts, American officials said.
The first evidence of the new strategy came on Oct. 21, when B-1 bombers and other allied warplanes hit 26 targets in the Omar oil field, one of the two largest oil-production sites in all of Syria. American military analysts estimate the Omar field generates $1.7 million to $5.1 million per month for the Islamic State. French warplanes struck another oil field nearby earlier this week.
The goal of the operation over the next several weeks is to cripple eight major oil fields, about two-thirds of the refineries and other oil-production sites controlled by the Islamic State, also called ISIS or ISIL.
“We intend to shut it all down,” Col. Steven H. Warren, a military spokesman in Baghda (snip)
http://www.nytimes.com/2015/11/13/us/politics/us-steps-up-its-attacks-on-isis-controlled-oil-fields-in-syria.html?_r=0
shortonoil on Sun, 15th Nov 2015 8:11 pm
With WTI now at $40, these guys are getting about $26 at the well head. For McKenzie County 11,200 foot wells with a 30% water cut they aren’t even covering lifting costs. That NDIC graph is going to look a lot stepper on the back side than it did on the front!
buddavis on Mon, 16th Nov 2015 7:55 am
Rock
The next time a CEO gets on an earnings conference call and tells everyone that they are drilling their marginal locations first and saving the good ones will be the first time that has ever happened.
Boat on Mon, 16th Nov 2015 8:56 am
buddavis,
That makes sense to me. After spending a lot of money on leases and research I wound want to recover that money and drill the best spot first.
Kenz300 on Mon, 16th Nov 2015 9:12 am
Boom…..BUST……
Nony on Mon, 16th Nov 2015 9:39 am
Of course they drill their best first (as operationally feasible, practical. E.g. A pad might be filled out first, zipper fracks, etc.)
However, you still expect the average production to rise if the amount of drilling is cut. Just by “culling the herd” (by cutting the worst half of the projects, as operationally feasible.)
That it has not increased is curious. Suggests something else going on. I’m not sure what, but some possibilities:
1. Cost is the more important vector than yield (shallower wells preferred, e.g.) After all price for oil has dropped faster than price for drilling/completion. So relative importance of cost should increase.
2. Operational reasons prevail (pad fillout, etc.). This is another form of cost.
3. HBP drilling.
4. Remaining drilling satisfies needed technical testing programs and this has higher priority for overall development than picking best wells.
5. Companies not able to well predict production. (Random variation creates the spread much more than understood differences of spot “sweetness”)
6. We are running out of sweet spots. (IOW the culling the herd aspect is happening but just keeping pace with what would be an average decline at higher rig rates).
7. Something else I haven’t thought of.
——–
1 ought to be a factor and one sees it for instance in the Marcellus versus the Haynesville in gas. But I don’t see the evidence of it driving things in the Bakken. Rigs seem to have collapsed into the Nesson Anticline and the Parshall and Sanish. Basically SW Montrail, NE McKenze. These are deeper wells and more prolific areas.
2 would be expected in terms of timing/scheduling and in terms of not building new pads. But wouldn’t seem to impact not doing high volume wells. Maybe a bit on the margin as downspacing is favored over stepouts because of the pad becoming a larger fraction of the NPV.
3. Seems unlikely for the Bakken as the operators have been saying for a while that they are mostly HBP and the rigs seem to have converged into the “old” areas.
4. Perhaps that happens on the margin, but seems unlikely to be a controlling factor for independent drillers. Even during the boom, they seemed to want to squeeze the Design of Experiments science in along with drilling the best first. Now even more so.
5. This occurs for sure to some extent, but still rig movements are clearly into the high IP areas and also for years one has been able to see the difference in production by area. It would just be a mitigating factor, but herd culling still ought to lift the average.
6. Seems ominously possible. For the history of the Bakken development, it has been interesting to see the sweet spot drilling out fight the refinement of techniques. Very surprised to not see average EUR not go up during a down turn and implies the field maturing. [A point for the peakers…even though it is happening many years and many barrels after they thought it would.]
7: Interested in speculation from others, especially Enno.