Peak Oil is You

Donate Bitcoins ;-) or Paypal :-)
Page added on December 13, 2014
Bakken and North Dakota Production Report

The North Dakota Industrial Commission just published their Bakken Monthly Oil Production Statistics and also their ND Monthly Oil Production Statistics.
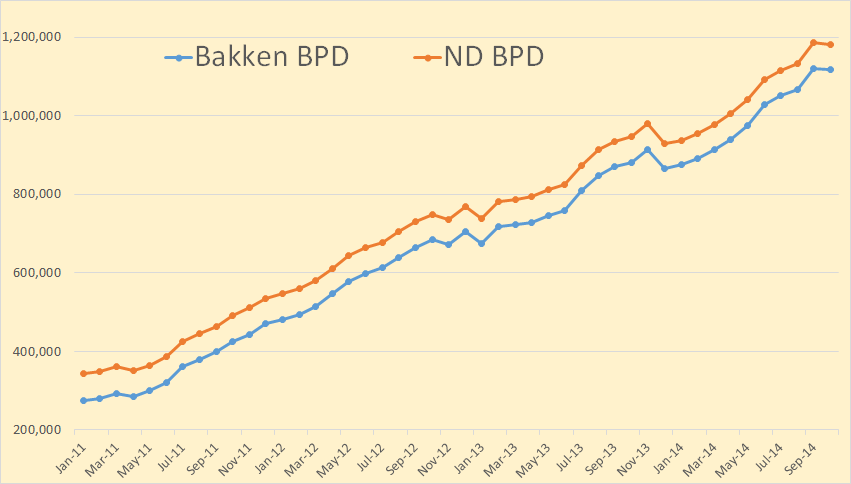
Bakken production was down 1,598 barrels per day to 1,118,010 bpd. All North Dakota production was down 4,054 bpd to 1,182,174 bpd.
From the Director’s Cut, bold mine:
The drilling rig count dropped 2 from September to October, an additional 3 from October to November, and has since fallen 5 more from November to today. The number of well completions decreased from 193(final) in September to 134(preliminary) in October. Three significant forces are driving the slow-down: oil price, flaring reduction, and oil conditioning. Several operators have reported postponing completion work to achieve the NDIC gas capture goals. There were no major precipitation events, but there were 9 days with wind speeds in excess of 35 mph (too high for completion work).
The drillers outpaced completion crews in October. At the end of October there were about 650 wells waiting on completion services, an increase of 40.
Crude oil take away capacity is expected to remain adequate as long as rail deliveries to coastal refineries keep growing.
Rig count in the Williston Basin is set to fall rapidly during the first quarter of 2015. Utilization rate for rigs capable of 20,000+ feet is currently about 90%, and for shallow well rigs (7,000 feet or less) about 60%.
Sep rig count 193
Oct rig count 191
Nov rig count 188
Today’s rig count is 183
Sep Sweet Crude Price = $74.85/barrel
Oct Sweet Crude Price = $68.94/barrel
Nov Sweet Crude Price = $60.61/barrel
Today Sweet Crude Price = $41.75/barrel (lowest since March 2009)
I just checked Rig Count. It now stands at 181 but one of them is drilling a salt water disposal well. So they have 180 rigs drilling for oil right now.
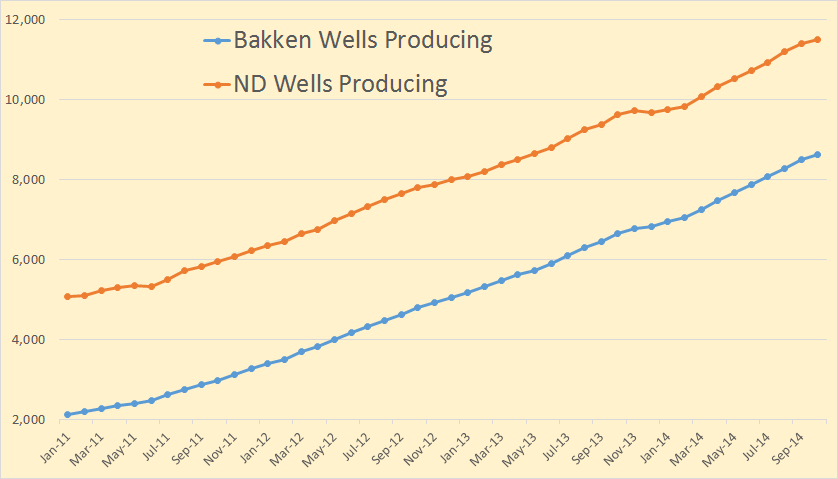
Bakken wells producing increased by 118 to 8,602 while North Dakota wells producing increased by 92 to 11,507. Since Bakken wells are included in the North Dakota count this means at least 26 wells outside the Bakken had to be shut down.
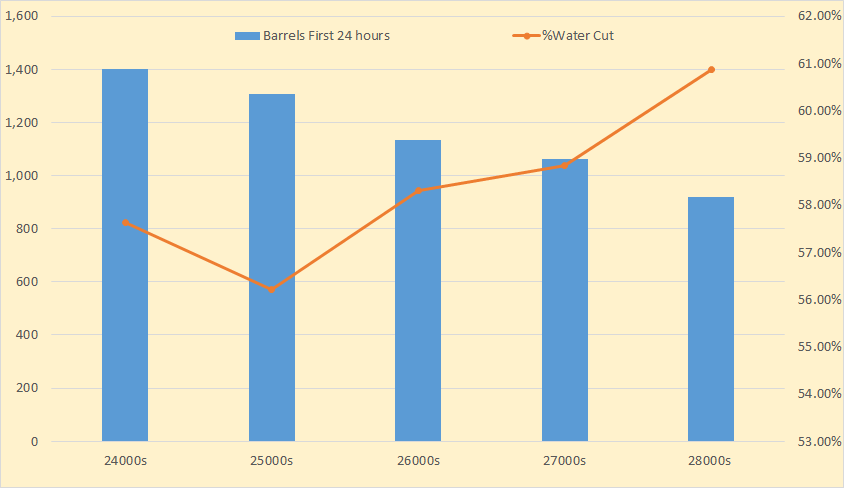
I am still tracking first 24 hours production by well numbers. I am now more convinced than ever that the first 24 hours production is a significant indicator of future production of that well. So far there are only 73 wells in the 28000s however.
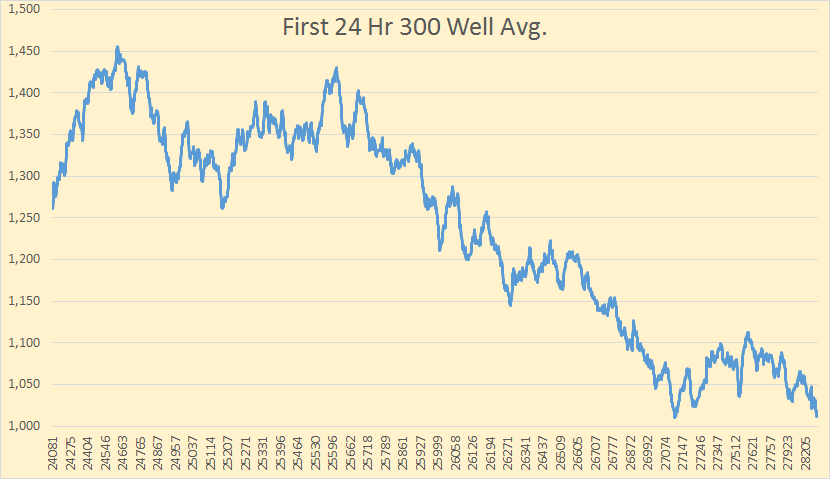
Using a 300 well average and sorting by well number you can see how the BOPD falls off as the well number gets higher. The 27000s seems to have leveled out but I believe it will keep falling as more higher well numbers come on line.
I have 2 weeks worth of data for December. There are 121 wells brought on line so far in December. But concerning the first 24 hours of water cut.
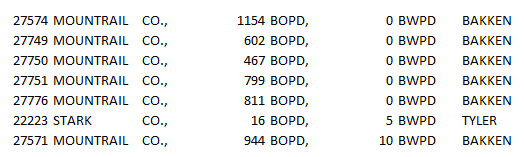
Everyone is telling me the first 24 hours is all fracking water so it means nothing. Welllll… I think the drillers have some way of accounting for that. I sorted the 121 wells I have so far for December by barrels of water per day. Above you see the seven wells with the lowest water cut. If the water that comes up the first 24 hours is all fracking water then there is a problem here. I am willing to hear opinions of what that problem is because I haven’t a clue.
Incidentally at the other end of the sort, the seven wells with the highest water in the first 24 hours, averaged 5,396 barrels of water per well and 1,898 barrels of oil per well.
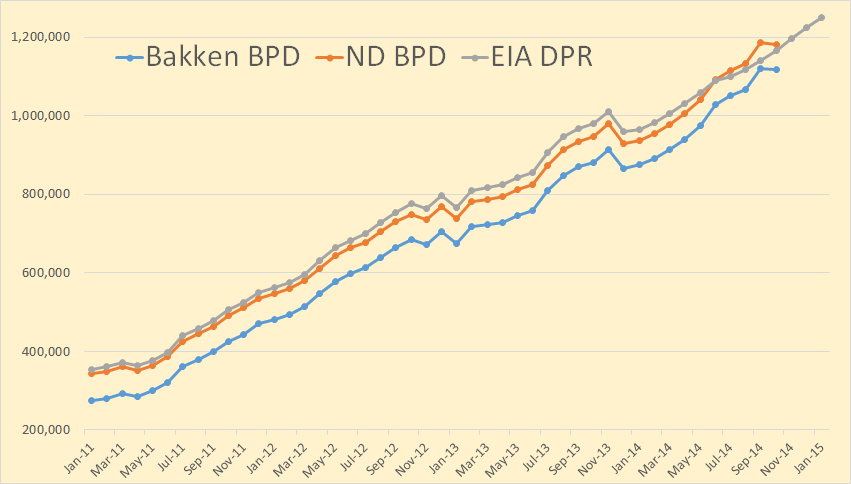
I have included the the Bakken data from the EIA’s Drilling Productivity Report here. Their data is for all the Bakken, including the Montana part, but not the non Bakken part of North Dakota. Their data goes through January 2015. The last six months of the DPR data is nothing but a wild guess.
I wanted to show the DPR data because people and the media keep pointing to it as if it were gospel as to what will be produced from all shale fields within the next two months. For instance this article: EIA: Despite lower crude oil prices, U.S. crude oil production expected to grow in 2015.
The recent decline in crude oil prices has created the potential for weaker crude oil production. EIA’s Drilling Productivity Report (DPR) includes indicators that provide details on the effect low prices may have on tight oil production, which accounts for 56% of total U.S. oil production. Analyzing these indicators and the changes in oil production following the drop in crude oil prices during the 2008-09 recession may offer some insight into possible near-term oil production trends.
They are expecting great things, at least through January 2015. From their report:

They are expecting light tight oil to be up 116,000 barrels per day in January. They think the Bakken will be up 27,000 bpd in January and Texas’ Eagle Ford and the Permian to be up a whopping 76,000 barrels per day.
I did the math. If these decline rates are right, then in January, these two fields will decline by 208,000 barrels per day. That is they will have to produce 208,000 barrels of new oil in January just to break even. Or if production declines by just 21.5% they will just break even. I expect new well production from these two fields, for most months next year, to be well below 208,000 barrels per day
The IEA has lowered their expectations for 2015 but only slightly.
Oil Market Report
Global production fell by 340 kb/d in November to 94.1 mb/d on lower OPEC supplies. Annual gains of 2.1 mb/d were split evenly between OPEC and non-OPEC. Surging US light tight oil supply looks set to push total non-OPEC production to record growth of 1.9 mb/d this year, but the pace is expected to slow to 1.3 mb/d in 2015.
6 Comments on "Bakken and North Dakota Production Report"
penury on Sat, 13th Dec 2014 2:34 pm
This s a great report. Thanks Ron, I just wish I had enough smarts to understand what I just read. I think it means, we got problems a-comin down the road.
JuanP on Sat, 13th Dec 2014 3:01 pm
Excellent work. My intuition tells me that Bakken’s production will decline at least until oil prices recover. If enough time passes before that, then future peaks may never reach past heights. As goes Bakken’s production goes the world’s, IMO.
This may mean that mid 2014 may end up being the all liquid fuels peak date.
tahoe1780 on Sat, 13th Dec 2014 3:08 pm
http://www.eriktownsend.com/
Very informative and interesting current newsletter.
Bill Peoples on Sat, 13th Dec 2014 4:30 pm
We look forward to getting a couple of water processing plants built in the Bakken in mid to late 2015.
Apneaman on Sat, 13th Dec 2014 10:39 pm
OVERSHOOT LOOP:
Evolution Under The Maximum Power Principle
http://www.dieoff.org/
Merton Johnsrud on Mon, 15th Dec 2014 12:39 pm
I found the Bakken and North Dakota Production Report interesting. I have
not studied it in great deal, but I put
little strength in first 24 hour production comparisons. The first meaningful numbers of oil production,
in my judgement, are the averages for
the first full 90 days. The comparison for water production would be much more
meaningful if it compared the daily
volumes after one year of production.
Todays high volume “slick water fracs”
can make numbers have extreme variances.
With oil IP’s, some operators actually
report the first 30 day average as an IP number. In contrast, one or two operators do an IP number with no choke, “flowing open tubing”.
There is no way to compare these results.