Peak Oil is You
Donate Bitcoins ;-) or Paypal :-)
Page added on December 9, 2011
Geologic Resources Supply – Demand Model (GeRS-DeMo)
")
Last year I placed a summary of my PhD thesis on The Oil Drum. The thesis described a new model that projects fossil fuel (coal, conventional oil, unconventional oil, conventional gas, and unconventional gas) for all countries to determine the world’s fossil fuel supply and demand. At the time I did not make the model itself public, as it was written partially in C++ and partially in Maple. C++ is free; Maple, however, is expensive. In 2010 I was lucky enough to work with Dr Gavin Mudd and by extension the Institute for Sustainable Futures (ISF), and I was able to add a recycling component to the model enabling the model to be applied to the projections of metals.
In 2011, I commenced work at the ISF. Recently the ISF very kindly allowed me time to convert the model out of Maple and into Excel, in the process making the model easier to use, and freely available. As a result, the model was placed on the ISF website. It can be found at this link.
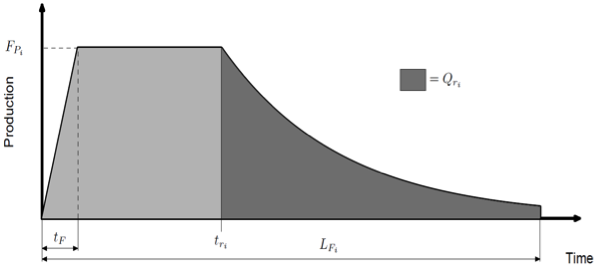
GeRS-DeMo – or Geologic Resource Supply – Demand Model estimates the demand, production (from mines or fields) and recycling of any geologic resource. The production from mines works by bringing idealised mines online throughout time and over time the supply and demand interactions allow more or less mines to come online and also mines to shut down earlier than expected (and restart later) or upgrade the mines (by doubling the mines production). The production from fields works by putting idealised fields online as shown in Figure 1. The sizes of the fields vary, with initial fields being relatively large, and a final fields being relatively small. Due to the variability in sizes, all fields in a given region are assumed to have two constant ratios (inputted) one between the maximum production to the Ultimately Recoverable Resources (URR), and the other for the URR remaining when production begins to decline relative to the URR.
Specifically, it can be used to predict the historic and future production, amount of recycling and demand of a metal, fossil fuel, or mineral. The simplest example (included in the link) shown is lithium production in Australia. In this case the projection is made by inputting likely mine productions and lives for actual current and historic lithium mines in Australia. When the example is run the graph shown in Figure 2 is generated.


I had considerable enjoyment creating the model and believe passionately in the need for detailed projections of key resources. I hope that you may consider using this model to develop your own projections of key resources, and I hope that the input sheet explains the inputs required in a clear fashion.
One Comment on "Geologic Resources Supply – Demand Model (GeRS-DeMo)"
BillT on Sat, 10th Dec 2011 3:42 am
Perhaps this should be a permanent post until EVERYONE has seen it…
http://sunweber.blogspot.com/2011/01/energy-in-real-world.html
“…Solar and Wind are not renewable. The energy from solar and from wind is of course renewable but the devices used to capture the energy of the sun and wind is not renewable. Nor are they green or sustainable.
An oak tree is renewable. A horse is renewable. They reproduce themselves. The human-made equipment used to capture solar energy or wind energy is not renewable. There is considerable fossil fuel energy embedded in this equipment. The many components used in devices to capture solar energy, wind energy, tidal energy and biomass energy – aluminum, glass, copper, rare metals, petroleum in many forms to name a few – are fossil fuel dependent…”