
The EIA updated their International Energy Statistics on Monday September 29. However there was an error in their data which I caught right away. They had Kazakhstan increasing C+C production by 856,000 barrels per day.
![]()
Above is their C+C data, January through June. I emailed Patrica Smith, the EIA employee who posts these stats. She emailed me right back:
Mr. Patterson, Thank you very much for catching the error. The numbers were transposed. I will ask the database manger to make the correction.
So I waited. The next day the correction had not been made so I emailed her back asking her for the correct numbers because this error also affected total world production as well as non-OPEC production. She emailed me back:
Mr. Patterson, The crude number should be 1520 instead of 2420.
So the number was off by 900 kbpd, Kazakhstan C+C production was actually down 44 kbpd instead of up 856 kbpd. And here three days later the correction still has not been made in the database. I think the international data is getting a very low priority these days. A few years ago, when the International Petroleum Monthly was still being published, they made a similar error. They had Canadian production one million bpd too high. I emailed Ms. Smith and the correction was made immediately and an email went out from the EIA, to all subscribers of the data, informing them of the data error and correction.
Anyway, the data for all charts below is in thousand barrels per day with the last data point June 2014.
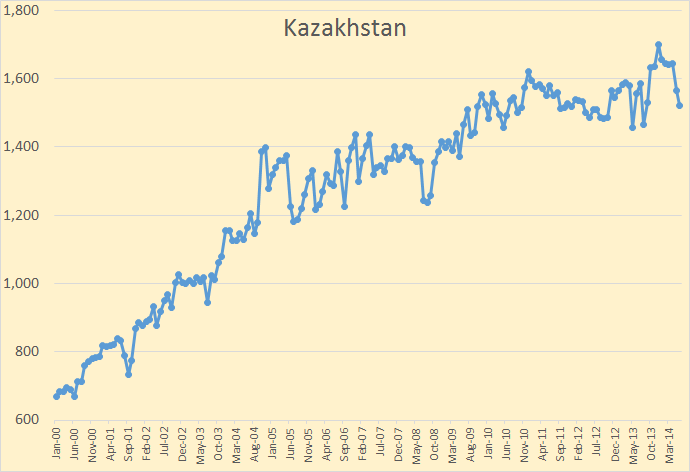
Production from Kazakhstan’s Kashagan field is not expected until the second half of 2016, or about two years from now.
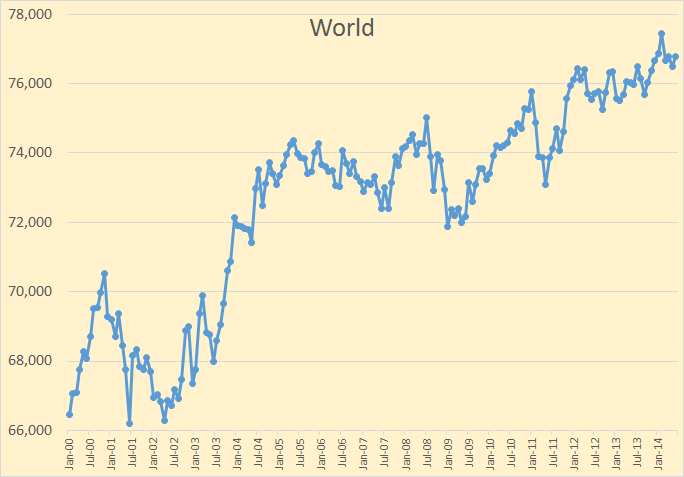
World C+C production was up 189 kbpd in June to 76,695 kbpd but is still down 747 kbpd below the peak in February.
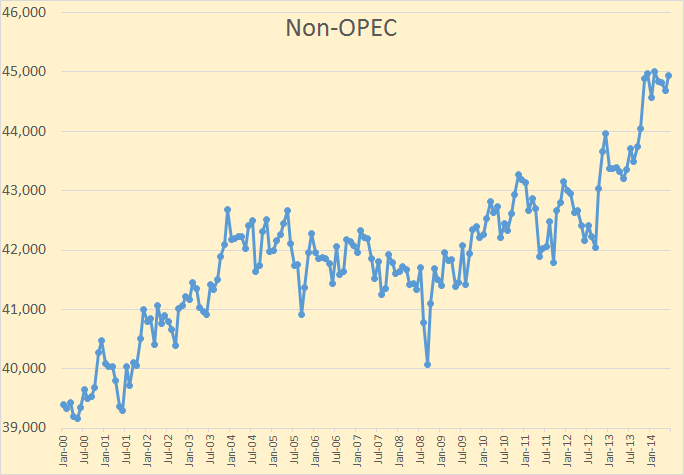
Non-OPEC production shot up last November and has pretty much stayed at that level for eight months. Non-OPEC C+C production, in June, was 44,837,000 bpd, up 153 kbpd from May.
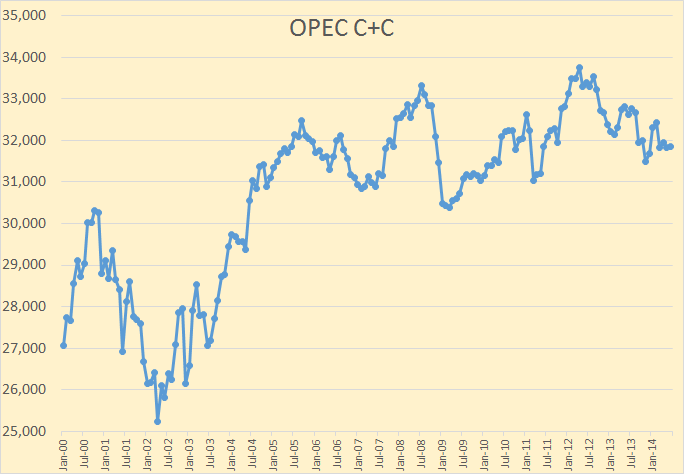
OPEC C+C, still about two million bpd below their peak in April 2012, seems to be going nowhere very fast.
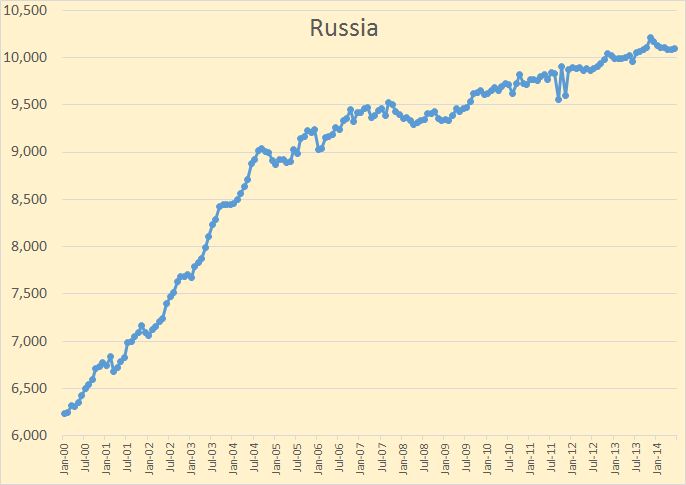
Russian production, according to news reports, is still producing near December high. (The EIA has their high in November).
Foreign-owned projects boost Russian oil output in Sept
Foreign-led projects lifted Russian oil output last month to within reach of a post-Soviet record, showing the potential in the country’s existing fields, which are largely unaffected by Western sanctions over Ukraine.
Output of oil and gas condensate in the world’s largest producer rose 0.9 percent to 10.61 million barrels per day (bpd) last month from August, a touch under the post-Soviet record-high of 10.63 million bpd reached in December, Energy Ministry data showed on Thursday.
The Russian Energy Ministry wishes to show that sanctions are having no effect, which makes me suspicious of the Energy Ministry’s data. However the EIA, apparently, does not get their data from the Energy Ministry or the Russian official web site CDU TEK. The EIA Russian numbers are always quite different from those Russia publishes. Apparently they don’t trust them either. You will notice the EIA data from the chart does not match the Russian data from the article. So we will just wait and see what the EIA comes up with for August and September.

And it is still USA production that is keeping the world from an obvious peak.
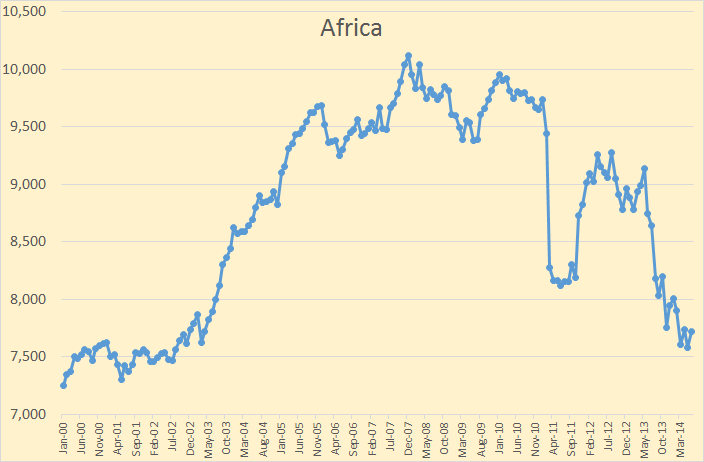
Africa is interesting, down 2,396,000 bpd since peaking in December 2007. The largest decliner is, of course Libya, down 1,505,000 bpd since that point. But other decliners are Algeria, down 315,000 bpd, Angola, down 246,000 bpd, Sudan and South Sudan, down 261,000 bpd, Equatorial Guinea, down 96,000 bpd, and Egypt, down 61,000 bpd.
Of course some African producers were up. Nigeria was up 40,000 bpd and Ghana, up 98,000 bpd during that period. But there were some other big decliners among the very small African producers. Chad was down 39,000 bpd and Tunesia, down 27,000 bpd. All of this since December 2007.
The pages Non-OPEC Charts and World Oil Production by Gegraphical Area have been updated.
Note: I send an email notice when I publish a new post. If you would like to receive that notice then email me at DarwinianOne at Gmail.com
Plantagenet on Fri, 3rd Oct 2014 1:27 pm
The EIA is a US government agency. Its not surprising when these big bureaucratic organizations make mistakes or are slow in correcting them.
Interesting to see in the world C + C production chart that world production has gone up about 5 million barrels a day since the production plateau ended in 2009.
Davy on Fri, 3rd Oct 2014 1:52 pm
Planter, “these” US Government agencies are doing this on a regular basis almost as if it is an unspoken policy. It is part of the corruption, manipulation, and distortion of statistics required to keep the public informed. It is nothing more than disguised lies.
Plantagenet on Fri, 3rd Oct 2014 2:23 pm
Davi—I don’t think you have to imagine a conspiracy engaged in deliberate distortion, corruption, and manipulation to explain these small errors in US government statistics.
Sheer incompetence is more likely to blame. Somewhere in an office in DC a bureaucrat typed in the wrong numbers. He was probably in a hurry to get the data input done and run out to his 3 hour-long lunch.
GregT on Sun, 5th Oct 2014 1:44 am
“It is part of the corruption, manipulation, and distortion of statistics required to keep the public informed.”
A correction, I believe, is in order.
It is part of the corruption, manipulation, and distortion of statistics required to keep the public UN-INFORMED.
least we forget, an informed public is the greatest weapon of democracy.
“Who will govern the governors? There is only one force in the
nation that can be depended upon to keep the government pure
and the governors honest, and that is the people themselves.
They alone, if well informed, are capable of preventing the
corruption of power, and of restoring the nation to its
rightful course if it should go astray. They alone are the
safest depository of the ultimate powers of government”
— Thomas Jefferson