Peak Oil is You

Donate Bitcoins ;-) or Paypal :-)
Page added on September 30, 2011
Deepwater GOM: Reserves versus Production – Part 1: Thunder Horse & Mars-Ursa

The world oil and gas 2P cumulative discoveries can be modelled with 3 cycles [NE: 2P discoveries represent those resources are proven as reserves plus those that probably shall become reserves; more details here]. For crude excluding extra-heavy oil, the first cycle corresponds to surface exploration (1900-1950); the second cycle to seismic exploration starting in 1930 and a third cycle corresponding to deepwater starting in 1990. Deepwater refers to oil resources that are found under water columns of 500 meters depth or more. This late coming discovery cycle has had a very important impact in several economies around the world, especially those of the OECD, that depleted their conventional resources much earlier. This 3 cycle oil discovery model trends towards an ultimate of 2200 Gb (crude less extra-heavy oil) against a cumulative production already past 1100 Gb.
Figure 1: world Oil (excluding extra-heavy oils – XH) and Gas cumulative discovery and production with respective models. |
 |
The importance of Deepwater Oil Discoveries
Deepwater discoveries are now making up a large part of the world crude excluding extra-heavy oil discoveries.
Figure 2: world annual crude less extra-heavy oil discovery and including deepwater. |
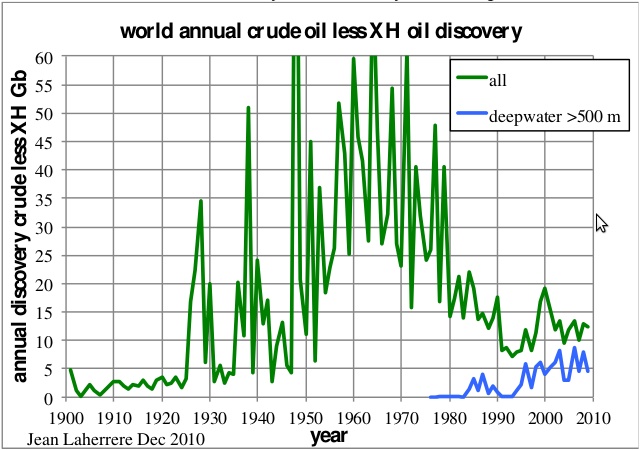 |
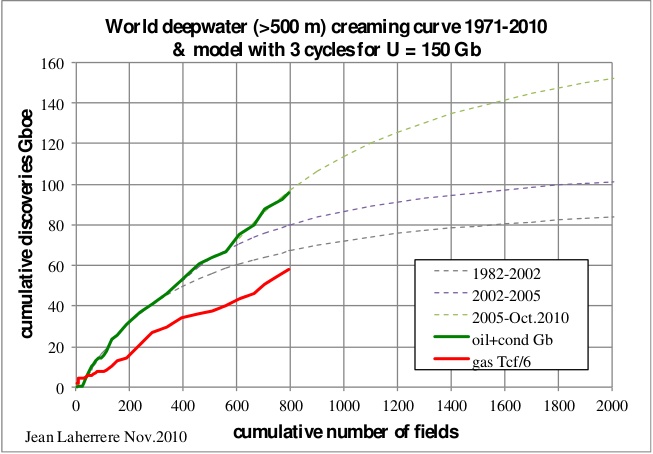
The ultimate for deepwater oil can be estimated at around 150 Gb from the creaming curve versus the cumulative number of fields. Deepwater oil is mainly found in the Gulf of Mexico (GOM), Brazil, Nigeria, Angola and Congo. The model is made with three cycles, the last one, starting in 2005, is associated with subsalt plays. A fourth cycle could occur if a new deepwater plays are found, like it occurred for natural gas in Israeli waters.
Figure 3: world deepwater oil & gas creaming curve modelled with an ultimate of 150 Gb. |
 |
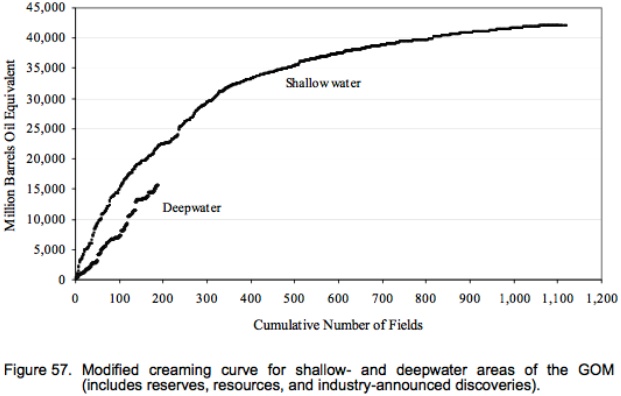
The MMS 2004-021 report entitled “Deepwater Gulf of Mexico: America’s expanding frontier” displays a similar creaming curve for the GOM comparing shallow water and deepwater (>1000 ft) . The shallow curve is really hyperbolic close to the asymptote; the deepwater curve seems to follow it but lower.
Figure 4: GOM oil & gas creaming curve for shallow and deepwater derived from the figures reported in 2004 by the MMS. |
 |
Zooming in on The Gulf of Mexico
But deepwater reserves estimates are questionable because they have not been yet confronted with long-term production (the same being true for shale gas). International oil companies are the main operators in deepwater plays and they are reluctant to revise their reserves estimate.
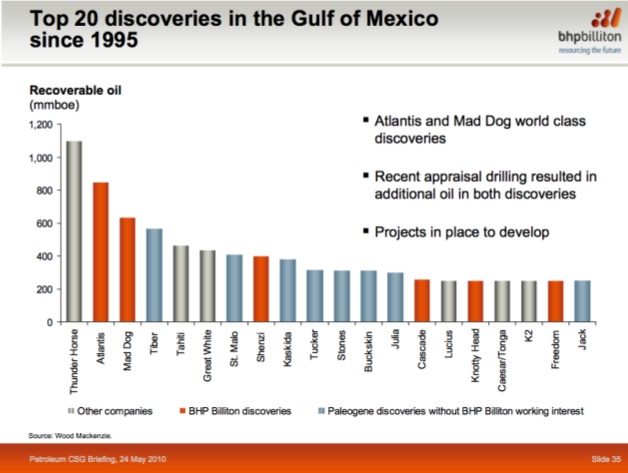
The GOM is the best place to study field data because there are numerous big fields and also for the monthly production figures (oil, gas and water) are available on BOEMRE’s (formerly MMS) site. BHP Billiton (2010) has published the top 20 discoveries in the GOM since 1995 but the largest field (for MMS) is Mars-Ursa found in 1989
Figure 5: top discoveries in the GOM since 1995 from BHP. |
 |
The goal of this series is to compare the evolution of reserves estimates with the actual production figures that show the oil decline. Let’s start with Thunder Horse operated by BP, followed by Mars-Ursa operated by Shell.
The Thunder Horse complex
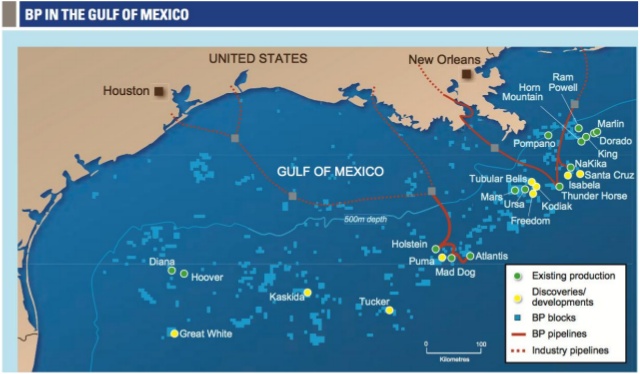
The Thunder Horse field was found in 1999 in deepwater (near 2000 m water column) in deep subsalt sediments (over 7000 m) with high pressure (1200 bar), 125 miles southeast of New Orleans. The field is operated by BP (75%) with partner Exxon-Mobil (25%). The discovery was first called Crazy Horse, but the name was changed quickly at the request of the descendants of the Native American warrior of the same name.
For BP (Frontiers Aug 2009) the field consists of two reservoirs, Thunder Horse South and Thunder Horse North produced by only one semi-sub platform.
Figure 6: map of BP discoveries in the GOM. |
 |
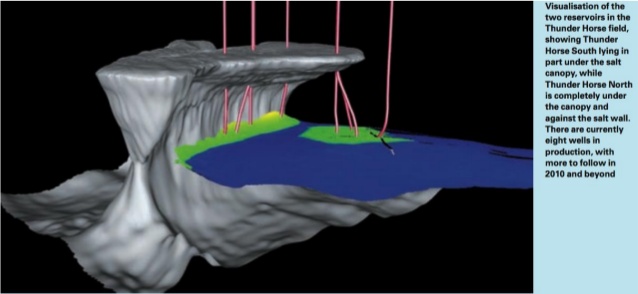
Thunder Horse South (called main or Thunder Horse) is a four-way structure in part below salt canopy, while North Horse North is a trap against the salt wall as shown in the following graph:
Figure 7: Visualisation by BP of the South & North Thunder Horse reservoirs showing the salt wall and the canopy. |
 |
From this graph, it is obvious that there are two fields located in blocks MC 775, 776, 777, 778, 821 and 822, but for some it is reported as one field, because production comes from a single platform in block MC 778. For the MMS there are two fields, MC 778 (main) and MC 776 (north):
The largest of the subsalt discoveries was made by BP and ExxonMobil at Mississippi Canyon 778, the “Thunder Horse” prospect, (OCS-G-09868 #1) in 6,050 ft of water in 1999. Thunder Horse is one of the largest deepwater Gulf of Mexico discoveries to date, with estimated reserves of 1 billion BOE. A second discovery, “North Thunder Horse” at Mississippi Canyon 776 (OCS-G-09866 #1), was made in 2000 in 5,636 ft of water. Industry press releases report that the entire Thunder Horse and North Thunder Horse field complex may have reserves of 1.5 billion BOE. Thunder Horse is scheduled to commence production in late 2005.
The following seismic line shows both the Thunder Horse plain structure in the middle with the log in green and on the left the north trap against the wall of the allochthonous salt (from Abu Chowdhury and Laura Borton, 2007, ”Salt Geology and New Plays in Deep-Water Gulf of Mexico”, Search and Discovery article #10132)
Figure 8: Seismic profile across Thunder Horse and Thunder Horse North (left). |
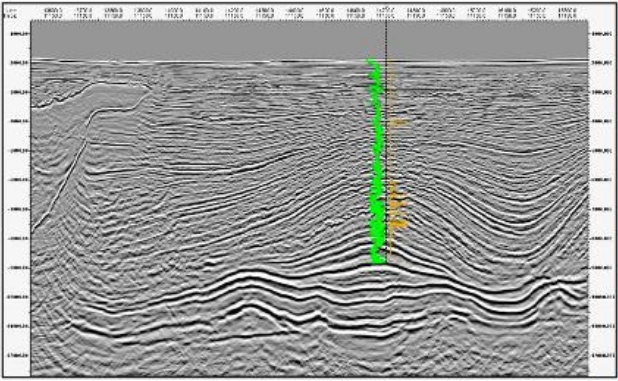 |
Figure 9: Thunder Horse semi-sub platform from Korea to GOM. |
 |
The Thunder Horse complex was brought on production with the largest semi-submersible platform ever built (130 000 t), assembled in South Korea and transported to the GOM on September of 2004.
But in July 2005 before production actually started, hurricane Dennis forced the development crew to leave and when they returned the semi-sub was tilting by 20-30°.
Figure 10: Thunder Horse platform tilted after Hurricane Dennis in 2005. |
 |
Due to a faulty ballast valve, water had entered the ballasts and expensive work had to be carried out to remedy all the damaged parts.
BP (Frontiers August 2009) was planning 28 production wells and 5 water injection wells, with a lifetime projected between 20 and 25 years (Dan Replogle). The facility is designed to process 250 000 b/d of oil and 200 Mcf/d of gas. Production eventually started in 2008.
BOEMRE provides field data for the GOM in their “Estimated oil and gas reserves” series, but the most recent report dates back to 2009 (MMS 2009-064) and only includes numbers up to the end of 2006. This report is very complete and can be freely downloaded in pdf format or as a series of spreadsheets. BOEMRE provides an annual report (updated every month for 2011, with the August issue presenting data up to the end of May) providing the monthly well oil, gas & water production as the number of days per well, sorted by field, lease and API number. But there are several other sources (the annual report is to over 7000 pages), all in pdf:
- by unit
- production by lease – PBP9152A: OGOR/9152, reporting separately crude and condensate, gas-well gas and casing gas and water
- production A sorted by lease – PBOGORAL : OGOR-A report 4081
The highest resolution source is per unit (I found later that it is incomplete, see part 2 of this series). The best source is production A per lease (OGOR A-well production data) but it is heavy and the necessary conversion from the pdf into a spreadsheet would a take a long time.
It is a nuisance to have several reports on the same data with sometime different values! Furthermore, these reports should be available in some spreadsheet format, or in plain text to make their usage on statistics/calculus software practical. The best report to deal with field data without bothering with individual wells is the “Estimated oil & gas reserves” series, but the latest issue is only contains data up to the end 2006.
Thunder Horse (main or south) MC 778
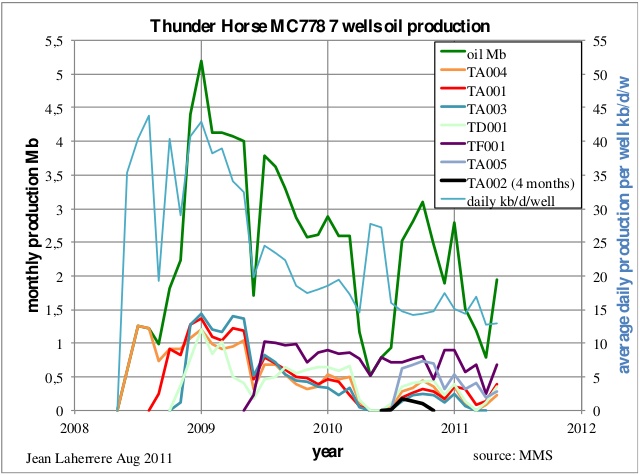
BOEMRE reports 7 producing wells, though one of them, TA002, only produced during 4 months in 2010, despite no water being produced; the production of each individual well varies widelly. The monthly oil production peaked in January 2009 at 5.2 Mb (168 000 b/d) with 4 wells, the average daily production per well peaked in 2008 over 40 000 b/d. In the next figure the wells are sorted by decreasing cumulative production at the end of May, 2011.
Figure 11: Thunder Horse MC778 oil monthly production: total and 7 wells individually plus average daily production per well. |
 |
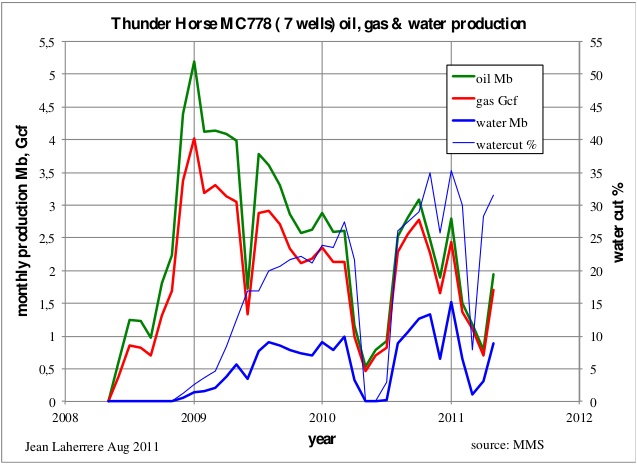
The production of oil, gas and water drops during periods of work over and also due to the Macondo oil spill in April of 2010.
Figure 12: Thunder Horse MC778 monthly oil, gas & water production. |
 |
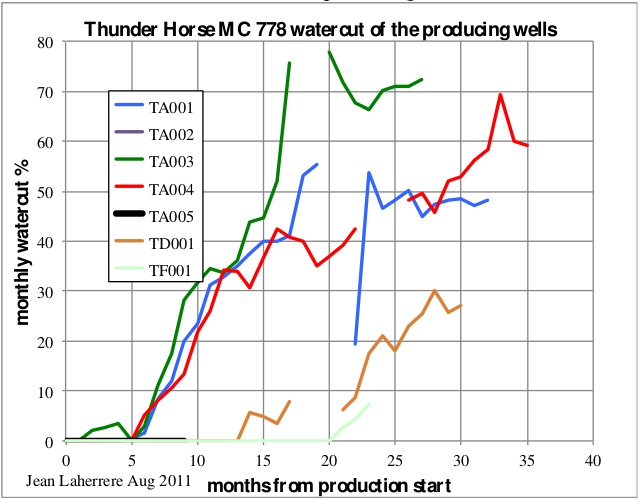
The individual well watercut from the production start varies widely: 20 months after the start it is still at zero for TF001, while for TA001 it is already over 70%.
Figure 13: Thunder Horse MC778 watercut of the producing wells from start. |
 |
The Thunder Horse oil production decline plotted versus cumulative production trends towards an ultimate of less than 150 Mb, when original reserves were estimated by the MMS at 757 Mb in 2002, 653 Mb in 2004 and 643 Mb in 2006 (the last estimate). It is obvious that these estimates were too high, though this field needs yet more wells drilled. BP in its turn does not publish enough data on the real potential of the field, no reserves have been reported by this company, and neither by Exxon-Mobil.
Figure 14: Thunder Horse MC778 oil decline, watercut and ultimate. |
 |
North Thunder Horse (MC776)
The MMS reports 8 wells with overall oil production declining in 2011 after a bumpy plateau; surprisingly, the water cut is also declining.
Figure 15: North Thunder Horse MC776 oil, gas and water monthly production. |
|
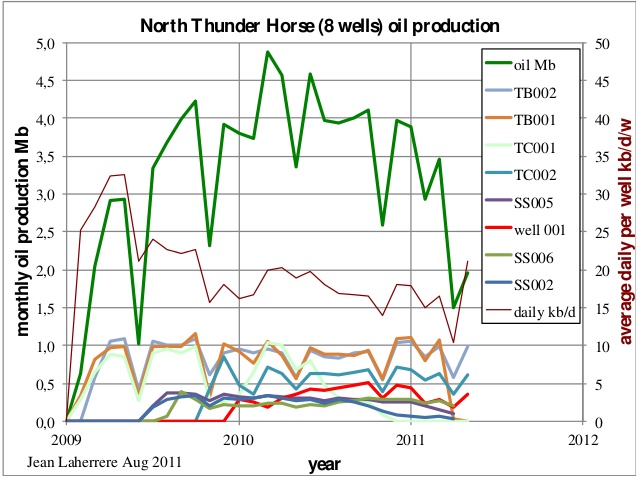
Oil production figures per well are bumpy and the average production per well peaked at 32 000 b/d, less than the main field data, which peakead at over 40 000 b/d.
Figure 16: North Thunder Horse: total and individual well monthly oil production plus average daily production per well. |
 |
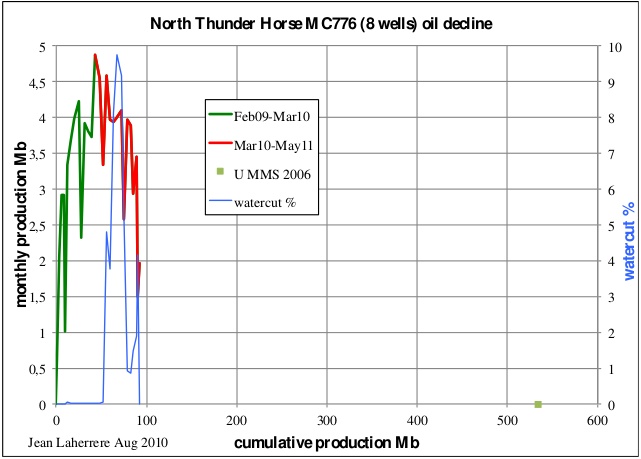
The monthly oil production versus the cumulative production displays a decline hard to extrapolate towards the ultimate value, which was estimated at 534 Mb by the MMS in 2006 (440 Mb in 2005 data, 365 Mb in 2004 data and 347 Mb in 2003 data). The watercut is also erratic.
Figure 17: North Thunder Horse MC776 oil decline, watercut and ultimate. |
 |
Thunder Horse main & north
The two fields are produced by the same platform (a semi-sub); their collective oil production displays a bumpy plateau with a peak above 7 Mb per month (about 240 000 b/d). The Macondo blow out (April-July 2010) has disturbed the production, which resumed in the Fall of 2010. There is a strong decline in 2011 due to the natural decline of the existing wells and the lack of new wells because of the drilling moratorium due to the Macondo oil spill.
Figure 18: Thunder Horse MC778 & MC776 monthly production and production days. |
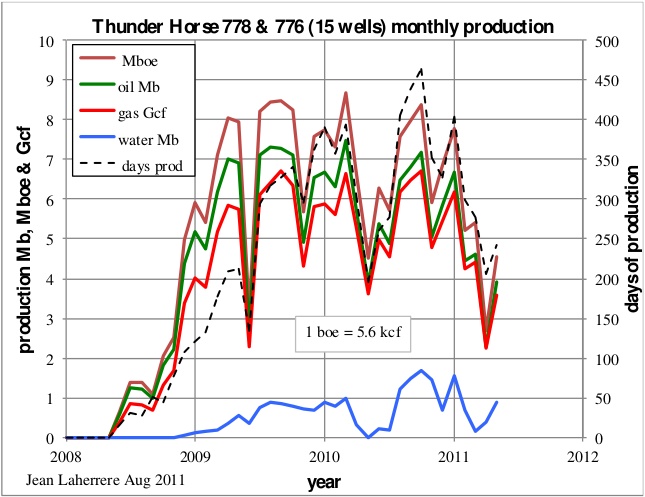 |
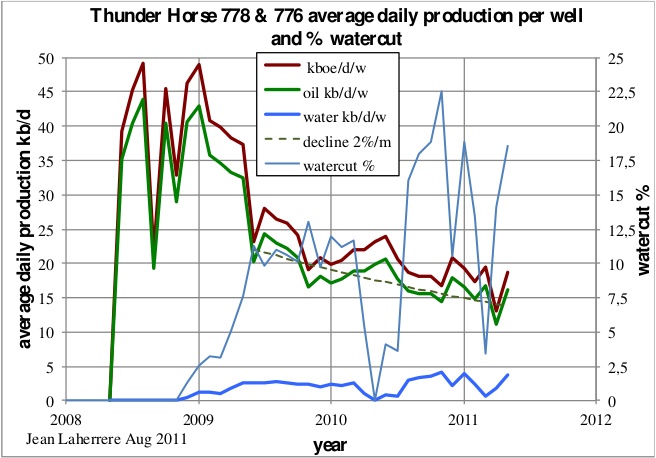
The total number of producing wells in May 2011 is 15, when the designed development was to consist of 25 wet-tree subsea wells, tied to the floating platform. More wells could be drilled, but BP has been very short in explaining this decline and its future planning. The average oil production per well shows a peak in 2008 at about 40 000 b/d/w, with a decline of about 2% per month (over 20 % per year).
Figure 19: Thunder Horse MC778 & MC776 daily production and Watercut |
 |
————————————-
Water production varies with the opening of new wells and the closure of some.
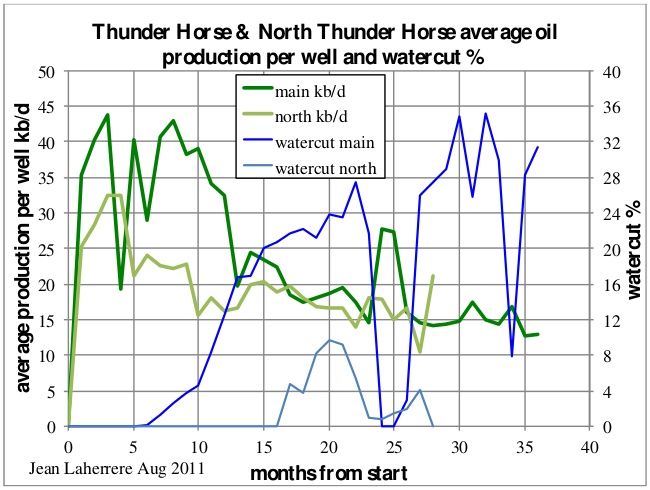
The comparison of the two fields (MC778, the main field and MC776, the north field) average production per well and global watercut starting from first production shows some difference, in particular for watercut likely due to the difference in trapping, but less for oil after the first year.
Figure 20: Thunder Horse: average daily production & watercut for MC778 and MC776. |
 |
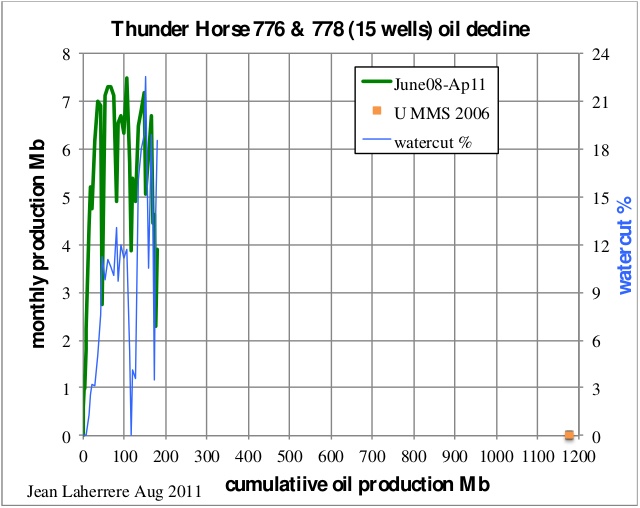
The plot of monthly production versus cumulative production, together with the watercut, does not present an easy extrapolation towards the ultimate, which was estimated at 1177 Mb in 2006, up from 1000 Mb in 2003.
Figure 21: Thunder Horse MC778 & MC776 oil decline and ultimate. |
 |
The lack of data from the operator on the future development of the Thunder Horse platform beyond the actual number of producing wells compared to the initial project, prevents a reliable forecast at this time. It is obvious that present producers are in steep decline, but the watercut varies widely. The future production depends mainly on the drilling of new wells.
A report by GlobalData (2010), “Thunder Horse, Gulf of Mexico, Commercial Asset Valuation and Forecast to 2035 or 2038″, (which costs 2800 $) includes the following in its description:
The field life of Thunder Horse is expected to be around 25-30 years with abandonment to start during 2036 without EOR or 2033 with EOR. The field is expected to generate $111.38 billion without EOR or $111.57 billion with EOR in revenues (undiscounted) during its remaining life (starting 1/1/2010) and is expected to yield an IRR of around 18.43% without EOR or 18.46% with EOR.
Like I always say: when more than 3 significant digits are given, it means that the author has a very poor knowledge of the accuracy of the reported value: the second digit surely must be wrong, and also likely the first digit. These 5 significant digits for the present net value of a field for a life of 25 years comes of a Monte Carlo simulation with many assumptions (in particular oil price) and the inaccuracy of such estimate should be at best 20%; the only conclusion is that EOR (which one?) does not change the result.
To conclude on Thunder Horse, there is not enough public data from the operator on future drilling to get a reliable extrapolation from the past production. But it is likely that the latest MMS estimates (MMS 2009-064 for 2006 reserves) are optimistic. It will be interesting to see the new estimate by BOEMRE, lacking data for the last two years!
Mars-Ursa
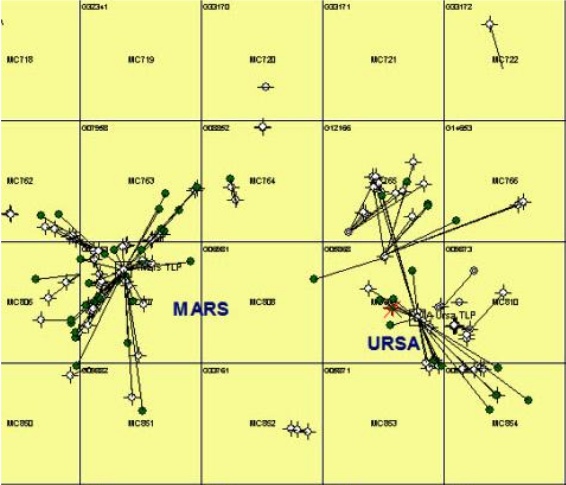
Shell publishes more and better data than BP on their GOM production. The two fields, Mars (found in 1989 on MC 763 at 966 m water depth) and Ursa (found in 1990 on MC 854 at 1225 m water depth), are grouped by BOEMRE under the name Mars/Ursa or MC807 as being the largest oil field in the GOM. Nevertheless, these two fields are clearly separated. They are both produced by Shell, but from two Tension Leg Platforms, being Mars on MC 807 since 1996 and Ursa on MC 809 since 1999. The Mars unit encompasses 6 OCS leases in the Mississippi Canyon Area – blocks 762, 763, 806, 807, 850 and 851 operated by Shell (71.5%) in partnership with BP (28.5%). The Ursa unit encompasses blocks 808, 809, 810, 852, 853 and 854, operated by Shell (45%) in partnership with BP (23%), Conoco (16%) and Exxon-Mobil (16%).
Figure 22: map of Mars and Ursa wells and platforms. |
 |
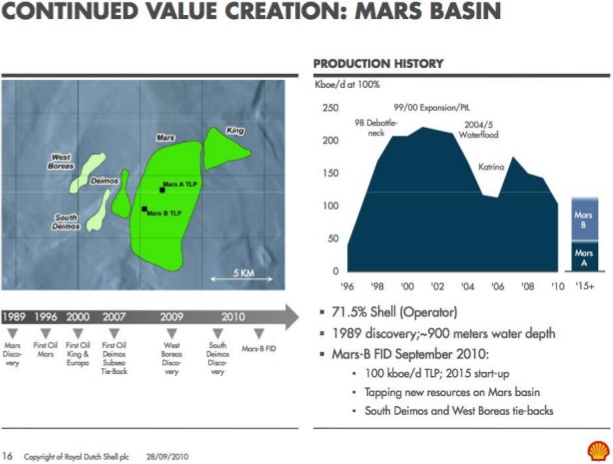
In 2008 Shell has achieved the Ursa/Princess waterflood project. In 2010 Shell announced that the present Mars A platform will be joined in 2015 by a new one: Mars B (called Olympus TLP), because of new close by discoveries: West Boreas & South Deimos. The Mars B development will draw production from eight Mississippi Canyon blocks: 762, 763, 764, 805, 806, 807, 850 and 851.
Figure 23: Mars-B future development for 2015. |
 |
Harris et al. in the article “Mars Life Cycle Field Development – Maximizing Recovery from a Deepwater Giant” (AAPG 2011) wrote:
The Mars Field is comprised of a thick sequence of stacked Plio-Miocene turbidite deposits trapped within a salt-flanked basin, with charge access to a prolific source rock. This geologic sweet-spot generated a field comprised of more than 70 individual reservoirs stacked in a 10,000 foot sequence. In-place volume estimates exceed more than 4 billion BOE.
The recent Near Field Exploration discoveries of West Boreas & South Deimos, along with the redevelopment study, yielded a 2010 decision to deploy a second 24 well Tension Leg Platform, “Olympus TLP” at the Mars Field. Addition of new infrastructure, complementing the existing facilities, provides a combined 48 well slots and over 7350K BOEPD processing facilities to optimize recovery from the Mars Field beyond 2050
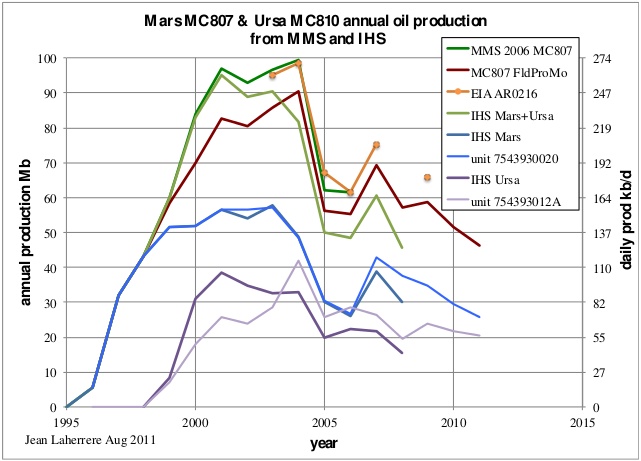
MMS annual reports includes only the combined production, while IHS reports both fields separately. Oil production was disturbed in 2005 by the Katrina hurricane, with production halted for the repairs of a damaged platform. The BOEMRE monthly reports (there are several, per unit or per lease) are slightly different. Mars (MC807) corresponds to unit 7543930020 and Ursa (MC810) to unit 75439012A. The annual oil production from MMS and IHS also differs, though both datasets show a clear decline disturbed by Katrina in 2005. The Mars field is declining faster than Ursa, possibly due to the Princess water flood.
Figure 24: Mars and Ursa annual oil production from different sources. |
 |
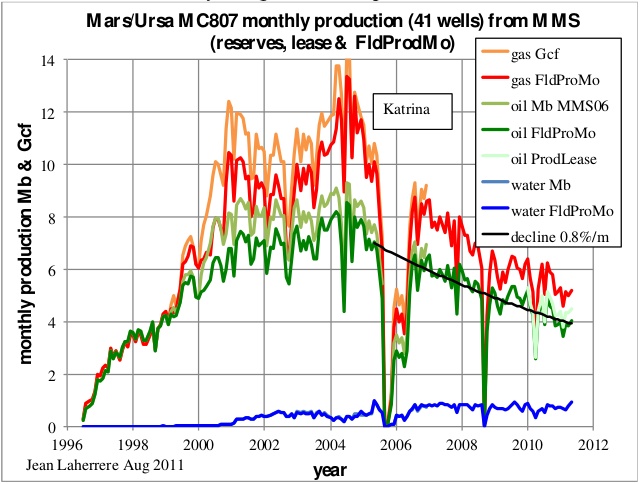
The monthly oil, gas and water production differs also slightly from the different MMS sources. The decline since 2007 is about 0.8 % per month or about 9 % per year, which is less than half the decline at Thunder Horse.
Figure 25: Mars/Ursa MC807 monthly oil, gas & water production from different MMS sources. |
 |
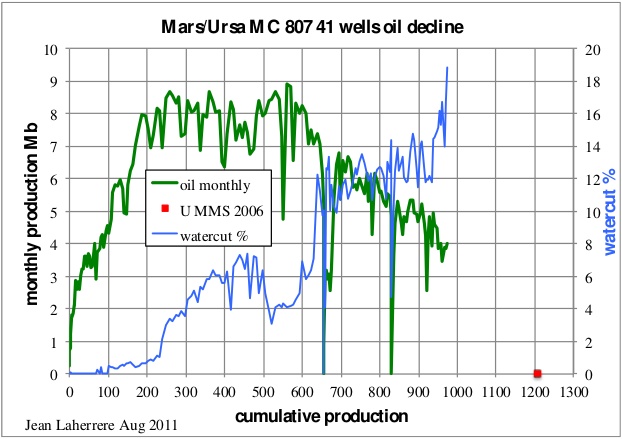
The monthly oil production versus cumulative production with watercut shows a decline in line with the reserves ultimate of 1208 Mb estimated by the MMS in 2006. Shell indicates that the new Mars B will bring secondary recovery (by waterflood as in Ursa) and access to new fields.
Figure 26: Mars/Ursa MC807 oil decline, watercut and ultimate. |
 |
Shell (M.Odum 2010) presented the development planning for Mars.
Figure 27: Mars map and planning. |
 |
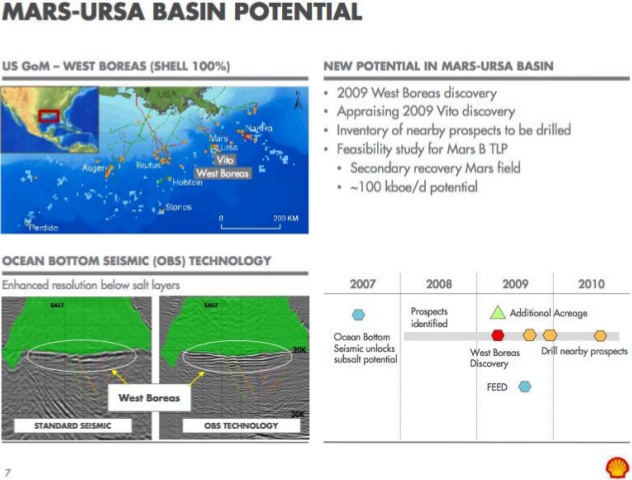
The planned Mars B Olympus platform starting in 2015 will slow the decline but part of its production will come from new discoveries, West Boreas (2009 on MC 809) and South Deimos (2007 on MC 806). The West Boreas field is trapped below the salt and the seismic profile is not easy to interpret, even with the new technology of ocean bottom recorders (Shell M.Odum Credit Suisse Feb. 2010).
Figure 28: West Boreas seismic profile from Shell |
 |
Conclusions to this installment
Regarding Thunder Horse, there is not enough public data from the operator on future drilling to get a reliable extrapolation from the past production. But it is likely that the latest MMS estimates (MMS 2009-064 for 2006 reserves) are optimistic. It will be interesting to see the new estimate by BOEMRE, lacking data for the last two years!
As for the Mars/Ursa complex, the monthly oil production versus cumulative production with watercut shows a decline in line with the reserves ultimate of 1208 Mb estimated by the MMS in 2006. Shell indicates that the new Mars B will bring secondary recovery (by waterflood as in Ursa) and access to new fields.
Following posts in this series shall present graphs on the Atlantis, Mad Dog and other fields.
Leave a Reply