Bakken Oil Peak by Jean Laherrère

The problem of forecasting future Bakken production is that estimating reserves of shale oil is harder than for conventional oil and is very unreliable because many confuse reserves and resources, and shale oil reserves depend more from economy than from technology. Many estimate the amount of hydrocarbons generated by the source-rock and believe that a significant percentage could be recovered: the study of the main Petroleum Systems in the world estimate than only about 1% will recovered in conventional fields, no more could be expected in unconventional fields.
US Shale gas production started in 1821 in Fredonia for lighting when whale oil price was about 2000 $2014/b, but was replaced by conventional oil in 1859 because a largely lower price.
How to estimate future production?
Drilling activity is a good way to model production with a shift.
In my MIT Paris paper «The end of the peak oil myth» MIT club de France- Paris 28 April 2014, I was convinced that North Dakota oil production will peak within 2014 using a correlation between oil production and shifted number of rigs, guessing the value of the shift and the relationship between rigs and production.
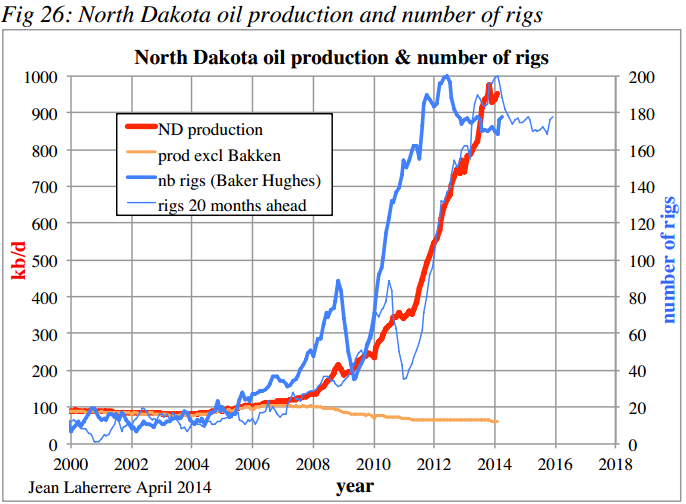
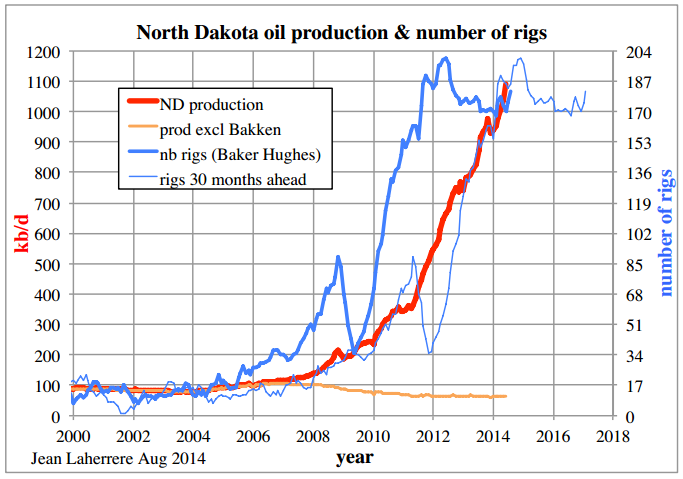
This April 2014 graph is wrong when adding present data at July 2014 (still rising after a minor peak in November 2013) and I have changed the shift from 20 months to 30 months and the correlation oil/rig, but I feel uncertain about the reliability of such graph.
When active in exploration I was used to drill 9 dry holes out of 10 wildcats: I am used to be wrong and I am not afraid of that. To make discovery you have to take risks.
My new model forecasts ND oil production peak in 2015 at less than 1.2 Mb/d, but again this new model could be wrong as the old one.
My modeling was based on the Montana oil peaks, which fit well with the number of rigs shifted by 12 months since 2000.
Continue reading →
The Texas RRC Oil and Gas Production Data is out with the June production numbers. I must repeat, as I do every month, that this data is much delayed and is and will be subject to updates every month, for about two years. Of course the latest months will be the ones which will be subject to the greatest revisions.
All oil data is in barrels per day. The last data point on all charts is June 2014.
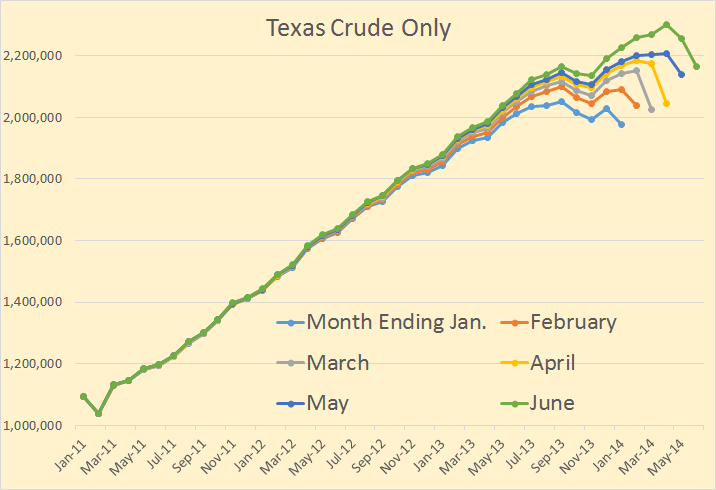
I have six months of data here to give you some idea of the revisions that can be expected in the coming months. Texas crude only is still increasing. My guess is that it is increasing by about 40 thousand barrels per month.
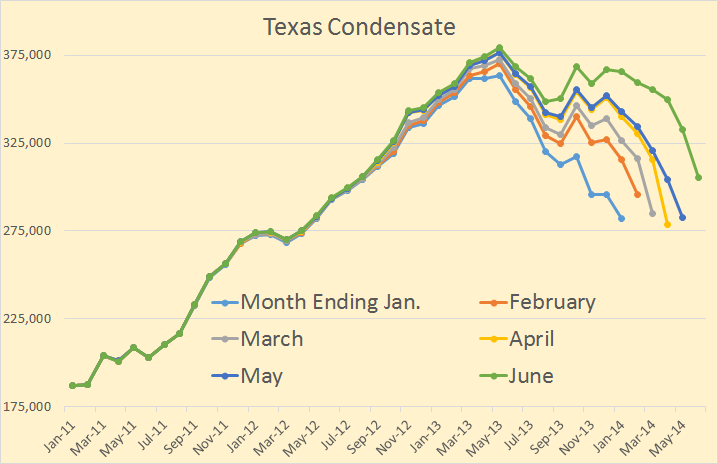
Texas condensate declined for three months in June, July and August of 2013 but has now started to increase again. I estimate that Texas condensate is currently increasing but only some months. It looks like Texas condensate production in some months is declining but in other months is still increasing by as much as 4 to 6 thousand barrels per month.
Continue reading →
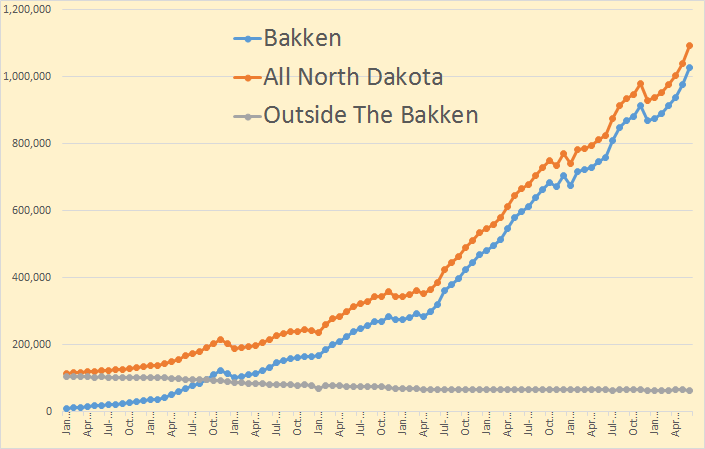
The Bakken and North Dakota production numbers are in for June. There was a big jump in oil production in June. The Bakken was up 53,162 barrels per day to 1,028,352 bpd. All North Dakota was up 52,148 bpd to 1,092,617 meaning the area outside the Bakken was down about 1,000 bpd.
From the Director’s Cut:
May Sweet Crude Price = $88.31/barrel
June Sweet Crude Price = $90.03/barrel
July Sweet Crude Price = $86.20/barrel
Today’s Sweet Crude Price = $79.50/barrel (all-time high was $136.29 7/3/2008)
The drilling rig count was up one from May to June, and up two more from June to July.
The number of well completions increased as weather impacts eased in June with
significant rainfall on 2 days near Minot and 1 day near Dickinson. However, there were
still 6 to 8 days with wind speeds in excess of 35 mph (too high for completion work).
At the end of June there were about 585 wells waiting on completion services, a decrease
of 25.
For the first time in a couple of years he did not give us the exact number of new well completions, only that they increased. Last month there were 227 well completions and production was up 37,000 bpd so we can assume there were aroun 235 to 240 new well completions in June.
Well completions should not be confused with “additional wells producing. That is and entirely different figure.
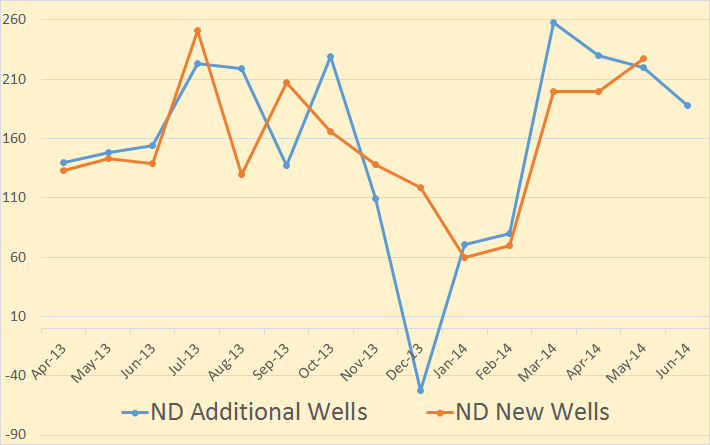
Additional wells producing is new wells completed, plus previously shut down wells brought back on, line minus wells shut down. Sometimes this number goes negative as it did in December of 2013. That month “Wells Producing” dropped by 52 even though there were 119 new wells completed. All data is barrels per day.
Continue reading →
Like BP, OPEC, the EIA and the IEA Russia also publishes an annual energy outlook. It is called the Global and Russian Energy Outlook to 2040. It is published by The Energy Research Institute of The Russian Academy of Sciences and The Analytical Center for The Government of The Russian Federation. I have no idea who these guys are but their titles sound impressive and they seem to be Russian think tanks funded by the Russian Government. But that is just an assumption of mine.
It is a very large 175 page PDF file that appears to be very scholarly and well researched. However they appear to be very optimistic in their prediction of the future oil supply out to 2040. In one scenario they are not optimistic at all for coal production however.
The report has three scenarios, the Baseline Scenario where business as usual continues until 2040. The New Producers Scenario where oil prices collapse due to overproduction and The Other Asia Scenario which is based on peak coal and the effect this will have on China and India. In that scenario they assume China coal production will peak within the next ten years. The Baseline Scenario assumes adequate supplies of coal will be available however. Only in the Other Asian Scenario do they figure in peak coal. All three scenarios assume plenty of oil will be available through 2040.
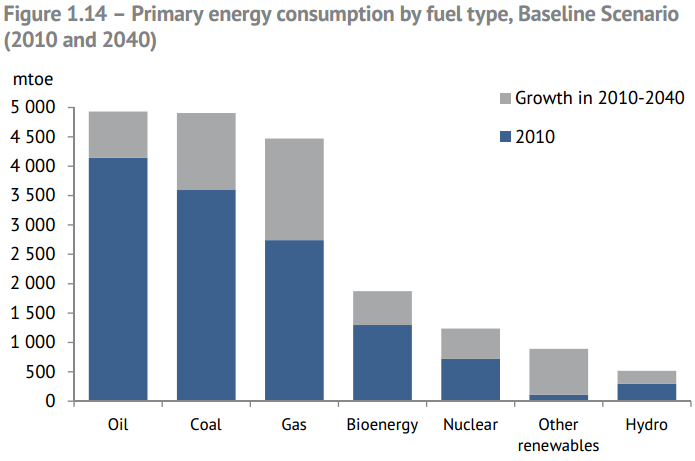 Obviously they don’t see any peak in oil production out to 2040, only growth. However they have coal and gas growing even more. And they seem to be very optimistic about “other” renewables. I don’t know exactly what that might be.
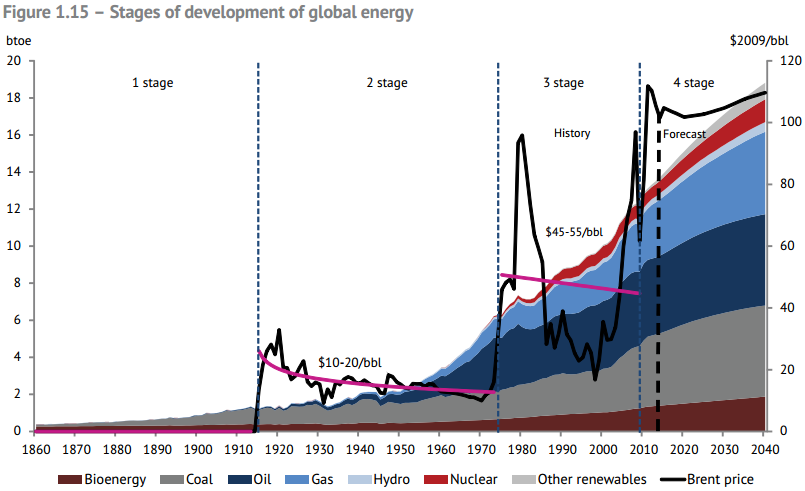
And here is their take with an oil price overlay. It appears they think, because production increases right along with demand, that the oil prices will remain flat.
Continue reading →
The first half of this post is a guest post by Enno Peters. The second half is taken from the latest EIA Drilling Productivity Report.
GEOGRAPHICAL ANALYSIS OF WELL QUALITY IN NORTH DAKOTA
by Enno Peters
SUMMARY
I was interested in doing a geographical analysis of the oil production in North Dakota. Detailed information made freely available by the NDIC allowed me to analyze how, geographically, wellperformance has been changing over time, in the area of North Dakota where most oil is produced.
RESULTS
In the following animated gif, you will see part of North Dakota. It contains the North West corner that borders Montana and Canada. The scale is in miles, with a rather arbitrary origin. Projected on this map is a contour map. The numbers of these contours are the cumulative 1 year returns for wells drilled within that area, and the unit is 1000 barrels of oil (no gas). For example, contours with the value 50 mark the area in which wells produced at least 50 k barrels of oil in their first year.

I could calculate the surface areas of several levels of first year well returns, in order to determine the trend of these areas. In the following chart you can see for each year the (estimated) surface volumes for 3 levels of first year well returns, 50k, 80k, and 110 k barrels of oil.
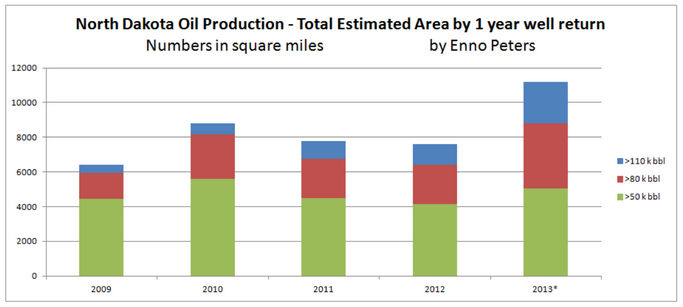
The sudden increase in 2013 of estimated productive surface area, in which wells could produce at least 50 k barrels of oil in their first year, may be explained by
1) the fact that I could only use data until June 2013 (as the 2014 May data is currently the latest one available), and therefore the number of data points are 1/3 of what I have for 2012. The method to determine the contours may not be suitable with this number of data points.
2) changing well practices
3) entering of new formations
So far I suspect that it is mostly 1), but that 2) and 3) could also be part of the answer, and therefore recommend to mostly ignore the 2013 results for now.
As a guide to interpret these results, I estimate (based on a discounted cash flow analysis) that a well that returns 50 k barrels of oil needs a minimum WTI price of about $120; about $82 WTI is needed for 80 k wells or better, and a well that returns 110 k barrels of oil in its first year is about even with $64 WTI. These are rough indications; I have seen a good analysis that estimates 10% higher required WTI prices for these levels of well performance. With current prices that would mean that 50 k wells are not profitable, while 80+ k wells clearly are.
I further estimate that the estimated total oil return (EUR) of a well is just over 4 times its first year return.
METHODS & DISCUSSION
My analysis is based on the public individual well data from NDIC. NDIC also provides the latitude and longitude for all wells, and based on that I could create plots of 1 mile by 1 mile, in which I averaged the 1 year well returns from wells in that plot (although most plots just have 1 well, at least currently).
For the 1 year return, I count all the oil produced by the well until the 11 month after its peak month.
This is slightly more than 1 year, as most wells produce also in the month(s) before the peak month, but this amount is not so much more, and it partly corrects for the fact that I don’t calculate the actual producing days (which is less than the calendar year), which is not (easily) available. Although the numbers go to 120.000 barrels of first year return, there are a few cases where much higher returns were achieved, even up to 350.000 barrels. For clarity these are all grouped in the 120.000 barrels category. The average first year return for plots with > 120.000 barrels was 155.000 barrels.
Based on those plots, the contours were created. The method I used for this is called Kriging (provided by the GIS software).
As my GIS knowledge is limited, the projection of the data on the map is slightly distorted (as Google maps have this distortion), but the distortion is less than 10 miles, and for most areas much less.
Unfortunately the public NDIC data doesn’t provide individual data for the different geological formations. It would have been interesting to see this analysis for each formation (Middle Bakken, Three Forks, etc). NDIC estimates more than 95% of the activity targets the Bakken and Three Forks, so these results include mostly these formations.
As I wanted to zoom in on the most productive area of ND, I only include part of North Dakota. It will be very interesting to see in the coming period how the well spacings develop, e.g. how many wells can be productively squeezed into these productive areas, which will then give a more complete picture of how this trend will develop.
I would like to thank Rune Likvern for his numerous insights and comments, and WES453 for showing where to get the well location data in an easy way, without which this would not have been possible.
___________________________________________________________
This marks the end of Enno’s post. It was rather short so I decided to combine it with a bit about the EIA’s latest Drilling Productivity Report.
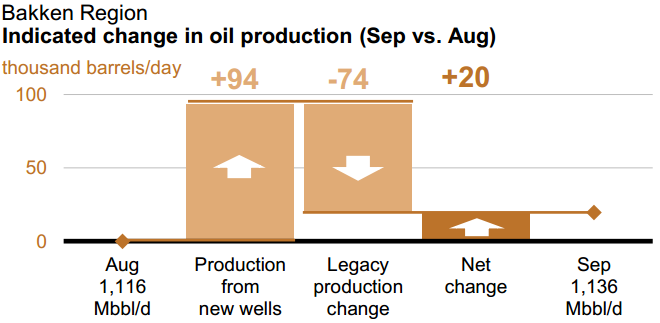
The Bakken must produce 94 kbd of new oil in order to increase production by 20 kbd. That is because the old wells declined, or will decline in September, by 74 kbd. They are assuming the Bakken will produce 1,135,441 million barrels per day in September. This would mean that the Bakken has a decline rate of 6.52 percent per month.
Assuming each new well produces, the first month, 400 bpd, then they would need 184 new wells per month just to break even.
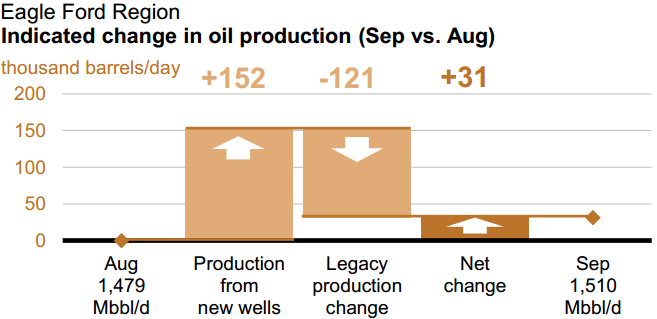
In Eagle Ford they must produce 152 kbd of new oil just to increase production by 31 kbd. The EIA expects Eagle Ford to produce 1,509,863 barrels per day in September. Eagle Ford’s old wells will decline by 121 kbd. That gives them a decline rate of 8 percent per month.
If their new wells produce an average of 400 bpd the first month then they would need 302 new wells just to keep production flat. However each new well may produce more than that. I have seen no stats on what the average new well produces in Eagle Ford.
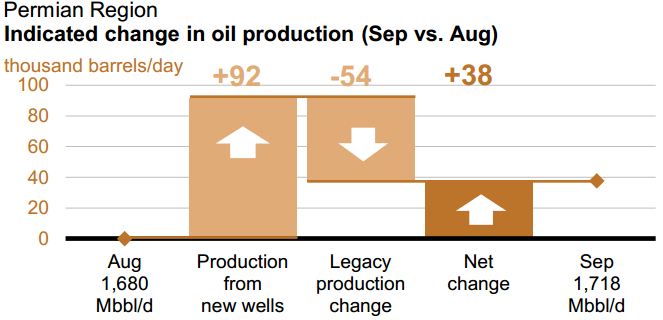
The Permian is the largest field in the USA. They expect the Permian to produce 1,717,750 bpd in September. New wells will produce 92 kbd while old wells will decline by 44 kbd giving a net increase in September of 38,000 barrels per day.
The Permian has the lowest decline rate of any LTO field, 3.16 percent per month. That is because many of the Permian wells are conventional wells. But at 400 barrels per day per new well it requires 135 new completed wells per month to keep production flat.
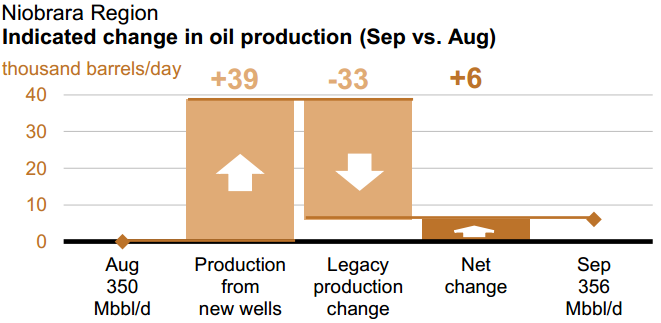
Niobrara according to the EIA, will produce 356,445 barrels per day in September. They will have 39 kbd of oil from new wells and a decline of 33 kbd from old wells giving them a net increase of 6 kbd. Niobrara has a whopping decline rate of 9.17 percent per month and needs 82 new wells per month to keep production flat.
The EIA has three other LTO areas, Haynesville, Marcellus and Utica. Utica is a new one they just added this month. However it literally the area of the Marcellus that is in Ohio. But they have little change each month. For September they showed no change for Haynesville, they have Marcellus up 1 and Utica up 3 kbd.
This you might find interesting. Listed below is the total decline of all LTO fields in barrels per day.
Field Decline in barrels per day per month
Bakken 74,022
Eagle Ford 120,806
Haynesville 1,087
Marcellus 2,146
Niobrara 32,684
Permian 54,202
Utica 2,373
Total Decline 287,320
Every month the oil production from all Light Tight Oil fields in the US decline by 287 thousand barrels per day. And if production keeps increasing that figure will be between 350 and 400 barrels per day per month by the time the peak arrives. That is a huge decline unless they can keep that Red Queen running like hell.
However, this is important: While the Drilling Productivity Report does eventually catch up and report the actual data, their production numbers for the last 9 months or so must be taken with a grain of salt. Example below, the last data point is Sep. 2014:
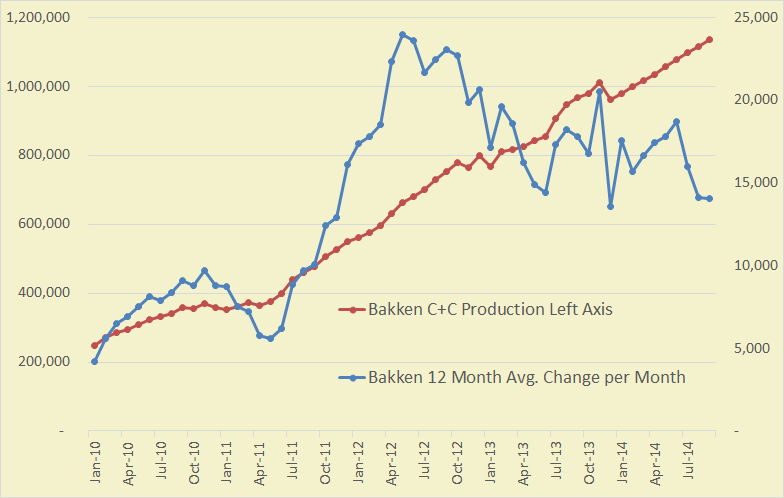 They are reporting the correct numbers, total Bakken North Dakota + Montana, through December 2013, but for the next nine months it is pretty much a straight line, averaging about 19.5 kb/d increase every month. However that is pretty close to the actual reported numbers by North Dakota and Montana average (through May), their numbers are not nearly that linear.
The Right Axis is the 12 month trailing average of the change per month in barrels per day.
Basically the EIA’s Drilling Productivity Report is just guessing for the last nine months even though the near complete data, through May, is available, for all states except Texas.

This chart is comparable to the Bakken chart above but using the DPR Eagle Ford Data. Production is the left axis and 12 month average change per month is the right axis.
peak oil barrel

Nony on Sun, 24th Aug 2014 7:40 am
1. The Laherre article is a confused, disorganized mess.
2. Including 5 other POB posts is even more disorganization.
eugene on Sun, 24th Aug 2014 8:30 am
For the “disorganized: When you have, relatively, low initial production rates coupled with very high decline rates, it takes ever more drilling just to replace the lost production. When it takes all drilling to replace lost production (due to the high decline rate), the field has peaked. Some call this the “Red Queen” effect. The Red Queen is from Alice in Wonderland. The Red Queen had to run ever faster to stay in the same place.
But then I’m probably a “confused, disorganized mess” also.
Davy on Sun, 24th Aug 2014 8:57 am
Eugene, NOO always feels confused when he is confronted with limits of growth. LTG give cornies mental indigestion.
rockman on Sun, 24th Aug 2014 10:54 am
“The Laherre article is a confused, disorganized mess.”. SOP: when one can’t counter the message one attacks the messenger.
Outstanding effort IMHO. Most impressive: this is the first serious effort I’ve seen to inject the geographic factor. Which isn’t done by folks make such projections as “plenty of Bakken oil until 2040” based on curve projections which don’t take into account that there are a limited number of drill sites in every trend regardless of technology and the price of oil. Consider the results of one Bakken well drilled about a year go: it this was suppose to support such projections. Didn’t work out: not only did the well not find the projected reserves it didn’t even find the Bakken formation: it didn’t exist in this portion of the Williston Basin.
But even the presented methodology has a weakness: it depends on current drilling activity to make forward projections. As pointed out there are variables that affect such trends. But it doesn’t take into account the ultimate controlling viable: the limits of the trend. The time lapse graphic is fantastic. But notice it doesn’t extend beyond the Williston Basin. Naturally it shouldn’t since the play won’t extend that far. But the Bakken won’t be economical to develop across the entire Basin either as witnessed by the well I mentioned above. The only way to accurately map the future production potential is to first map the extent of “technically recoverable” Bakken oil. And no one has done that for an obvious reason: one has to drill all the potential locations. Once all the potential locations have been drilled we’ll have a pretty good idea of the ultimate recovery from the Bakken. LOL.
Until then such work as presented here will be the best approach to making an estimate IMHO.
Boat on Sun, 24th Aug 2014 11:58 am
Rock, are you saying the USGA estimates are historically inaccurate? It seems every time they do a survey in the Bakkens and Eagle Ford the estimated billions of barrels of recoverable oil increases.
Nony on Sun, 24th Aug 2014 2:47 pm
Rock:
I can think of several people whose theses on peak oil that I disagree with, but who do a good job of explaining it: Ron at POB, Kopits, Hamilton. Even Hubbert wrote a very clear (beautifully clear) paper.
This piece is in the not even wrong category. The Laherre stuff is a mess (reminds me of Rune…is it language, age?) And then you have 5 other POB posts mixed in?
Forget the peaker debate, it’s not even clear writing.
Oh…and dog: I’ve engaged on the content, plenty. Come up with new points, etc. Stop playing big frog ina little pond…start thinking. You’re actually one that I like a lot better than most here. But…big frog, little pond. There’s an entire industry that has drilled a well. Don’t let that shit go to your head. Kisses. 😉
Pops on Sun, 24th Aug 2014 3:23 pm
JL moved his bakken peak date because he first figured that a peak in rigs means a peak in production at some point in the future. He says he shifted the rig count ahead another 10 months but isn’t sure that will work either.
In the bakken there are lots of factors including weather, lots of logistical problems that limit drilling and completions but also it is kind of a lab for refining the technique. I think extrapolating the past in any fashion is a poor predictor there.
And I’ve been listening carefully to JL since the SciAm article. But I tried to chart the declining rate of increase for a couple of years myself until it flattened out last year.
Probably Hughes and DCs estimates based on “sweet spots” and max infill is closer.
Maybe
Speculawyer on Sun, 24th Aug 2014 3:33 pm
I admire his efforts but I don’t think we have sufficient data to get a good handle on the shale oil production curve. They are still finding new shale fields and the extraction technology continues to improve such that it is quite the moving target.
Hi Rockman!
rockman on Sun, 24th Aug 2014 3:54 pm
Boat – “…the estimated billions of barrels of recoverable oil increases.” Exactly. Not only am I saying the Survey estimates will be proven inaccurate so would the Survey tell you.
Why do you think this happens? It’s because more wells are drilled proving up more reserves in previously untested areas. In the real world the Rockman, the USGS, the EIA, et al work we have a much more narrow definition of “proven” reserves then many outside the oil patch utilize. In my 40 years I’ve been involved in the drilling of hundreds of wells. And just a handful of those targeted “proved reserves”. If a project has no proved reserves it has zero future estimated recovery. Once the well is drilled any reserves are added to the future recovery of a trend. And thus what you’re seeing: as more wells are drilled those unproven resource estimates are converted to proven reserve estimates. So as long as commercial wells continue to be drilled the previous estimates will be adjusted upwards. In other words the next time you see the Survey post a reserve estimate it will eventually be proven to be inaccurate as long as the drilling boom continues. The “reserve” estimate is based only upon drilled wells and to some degree on immediate offset locations…not on undrilled areas. As those areas are drilled “resources” estimates are converted into “reserve” estimates.
“Reserves” is a very often misused and misinterpreted term by many.
Eileen on Sun, 24th Aug 2014 4:51 pm
It looks to me like the article above is misposted. It looks like all the articles from Ron Patterson’s home page are posted instead of the original article here: http://peakoilbarrel.com/bakken-oil-peak-jean-laherrere/#more-4302
So my question is to which article are the comments directed?
Eileen
rockman on Sun, 24th Aug 2014 5:03 pm
Howdy Spec…been a coon’s age. “…don’t think we have sufficient data to get a good handle on the shale oil production curve.” That will still be true to a degree even when the last well is drilled. LOL. I give folks credit for their efforts. Personally I’ve never even considered doing the same in any trend I’ve explored in during my entire career. It’s of no value to me. I evaluate drilling projects that have a great deal of supportive data and rarely does that qualify any reserve estimate as proven. And when I’ve drilled the well and collected a myriad of data proving the reserves are there I still take any reserve estimate with a big grain of salt. About three years ago I drilled a very nice NG discovery. All the data clearly supported a productive life of several years at a minimum. And in 34 days the zone depleted. To this day I can’t come up with a geologic answer that comes close to explaining what happened.
I’ve seen hundreds of estimates of PROVED PRODUCING RESERVES based upon data based upon data AFTER wells were drilled. And in the vast majority of cases the estimate was always too high. It might be great sport for some to make sub efforts in these trends but for the most part they me very little to moi and even the folks drilling in those trends. None of the Bakken, Eagle Ford et al players are making drilling decision based upon ny of those numbers. They are using prospect specific data for each and every well they drill. That’s how drilling decisions are made…not on what the USGS or anyone else says the trend will ultimately produce.
Nony on Sun, 24th Aug 2014 9:02 pm
US production from fields tends to be larger than the proven reserves. Because accounting rules require a high degree of certainty for reserves estimates. They’re not median estimates.
buddavis on Mon, 25th Aug 2014 7:53 am
Reserves are what you pull out of the ground.