Peak Oil is You

Donate Bitcoins ;-) or Paypal :-)
Page added on May 23, 2011
The JODI-EIA Divergence

This is a follow-up on a discussion started by Darwinian (Ron) in the Drumbeat (here and here) that I think is significant and deserving more eyes. Lately, looking at the EIA data we have seen new production records in all the categories (see post by Gail here for a discussion):
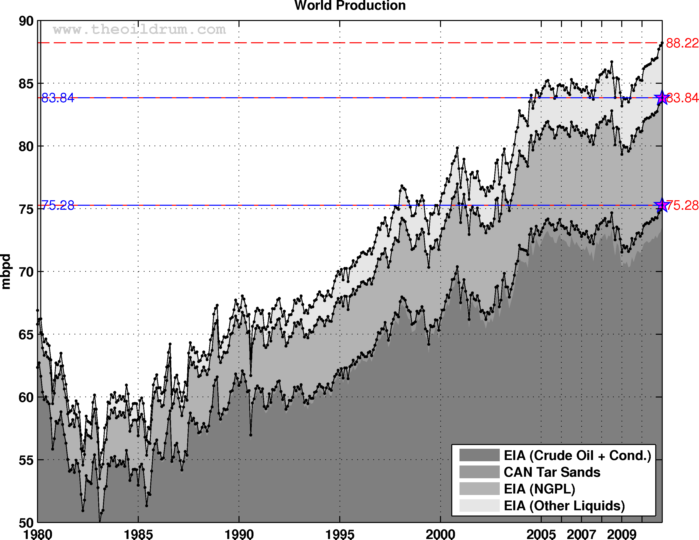
Figure 1. World production (EIA data), the last data point is January 2011. Blue lines and pentagrams are indicating monthly maximum. Monthly data for crude oil and condensates from the EIA. Annual data for NGPL and Other Liquids from 1980 to 2001 have been upsampled to get monthly estimates.
The public database JODI contains monthly data from more than 90 countries (90% of world production) but does not give a world production estimate, some countries are also missing or incomplete (about 20 countries), it gives something like this:
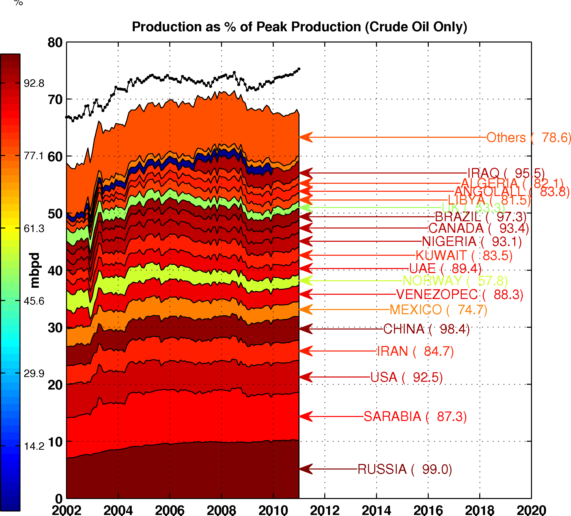
Figure 2. Production data from the JODI database (crude oil and condensate). The black dotted line is the EIA estimates. The color is a function of the current production as a % of maximum level observed since 2002.We can get the missing data from the EIA energy database, more precisely:
- Incomplete series: Iraq and Kazakhstan.
- Some Non-OPEC countries are not in the JODI database, we then get the data from the EIA (in total 124 small producing countries).
Once completed, we get the following chart:
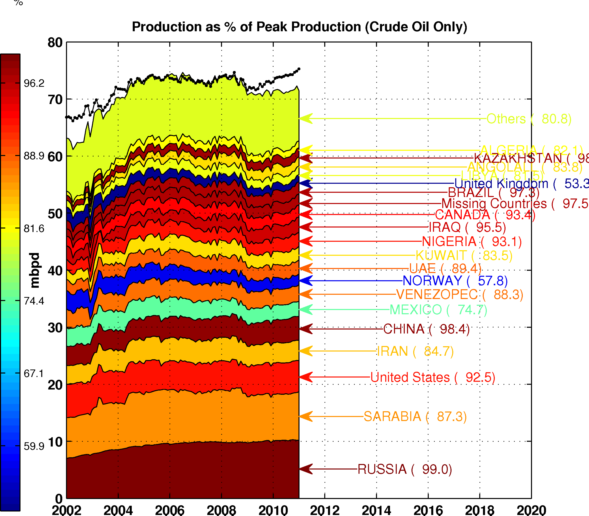
Figure 3. Production for crude oil and condensates from JODI (colored areas) completed for missing countries. The black dotted line is the EIA estimate.There is clearly a divergence since 2009 and also before 2005. The difference seems to originate both from OPEC and Non OPEC countries, OPEC production is significantly lower for JODI than for the EIA:
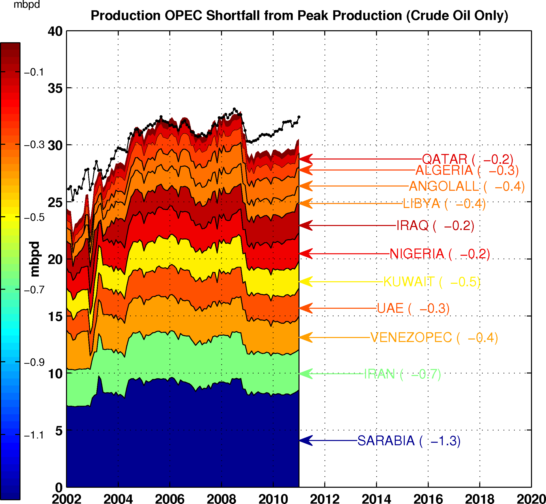
Figure 4. Same as Figure 3 but for OPEC members. The black dotted line is the EIA estimate. 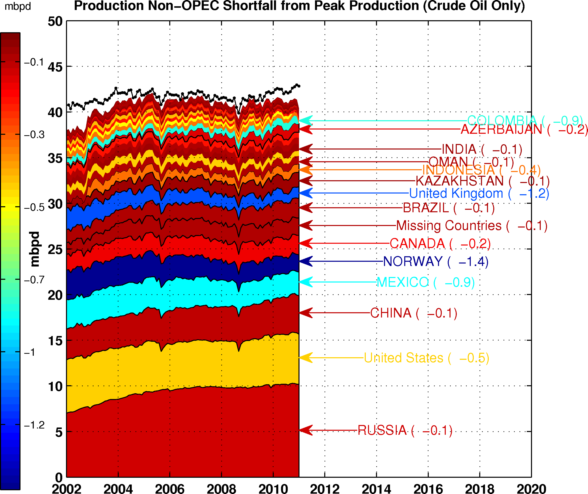
Figure 5. Same as Figure 4 but for Non-OPEC members. The black dotted line is the EIA estimate.
The chart below summarizes the difference between the two databases. We can see that even when adding the missing countries (the red area), we are not able to account for the difference with the EIA data.
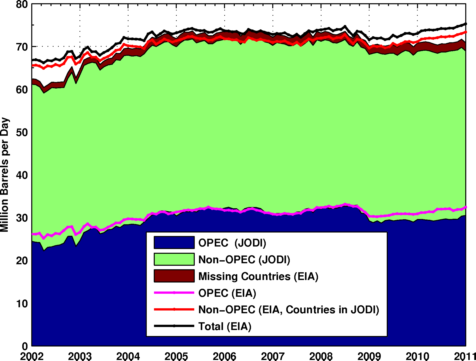
Figure 6. Production data from JODI with missing countries component (in red). The three lines are the corresponding EIA estimates.
We then add the EIA monthly estimates for NGL and other liquids to the JODI data past 2005 and we get a new version of Figure 1 shown below. The records for monthly supply are now back to 2006 for C+C and C+C+NGL. 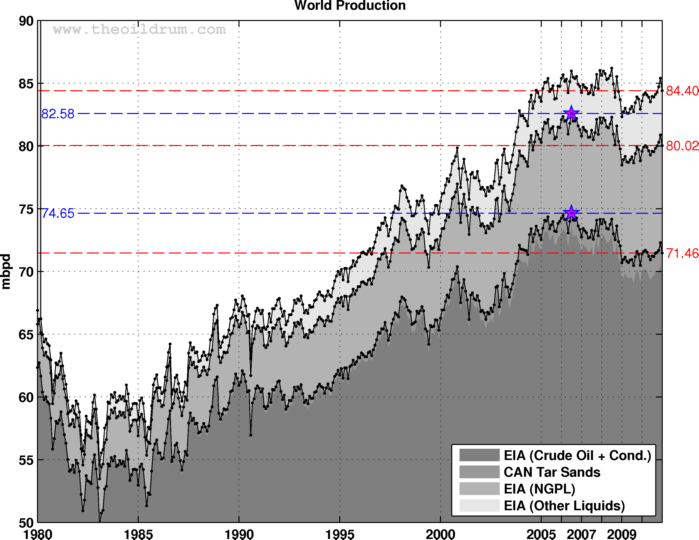
Figure 7. Same as Figure 1 but crude oil and condensates past 2005 is from JODI (see Figure 3). Blue lines and pentagrams are indicating monthly maximum.This is a significant divergence, in particular the drop in supply following the financial crisis in mid-2008 is more acute (~2 Mb/d lower) as shown on Figure 8 below. When looking at the EIA data only we can see that production levels have strongly increased since 2009 and are now close to the population based model (the magenta area) and the EIA 2008 forecast. However, this is not the case when using JODI estimate (shown as a green line), supply is much lower and it is following closely the average peak oil forecast (the red line).
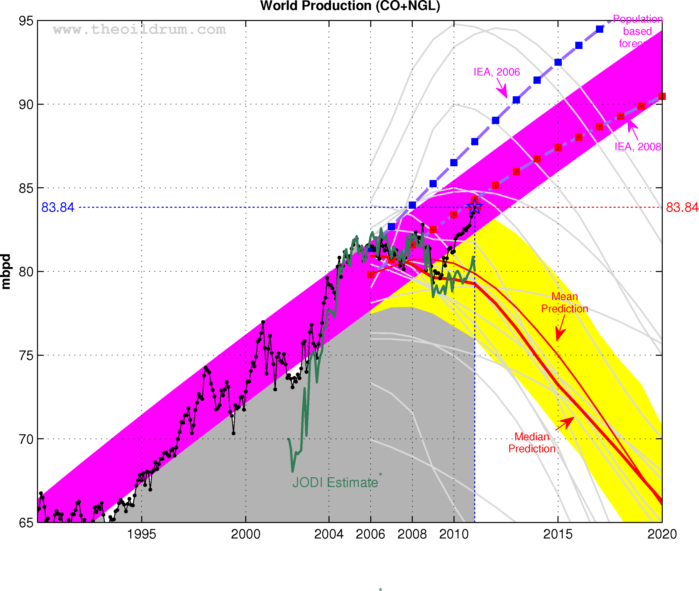
Figure 8. Average of 13 forecasts for crude oil + NGL, the magenta area represents a population based forecast whereas the yellow area represents the average domain for peak oil forecasts (see this post for details). The green line is the JODI estimate from Figure 3 and the back dotted line is the EIA data.I was struck by the fact that the JODI estimate is following the median forecast for crude oil and NGL whereas the EIA trajectory came back in the business as usual domain. The new production data based on JODI seems to follow closely most peak oil forecasts:
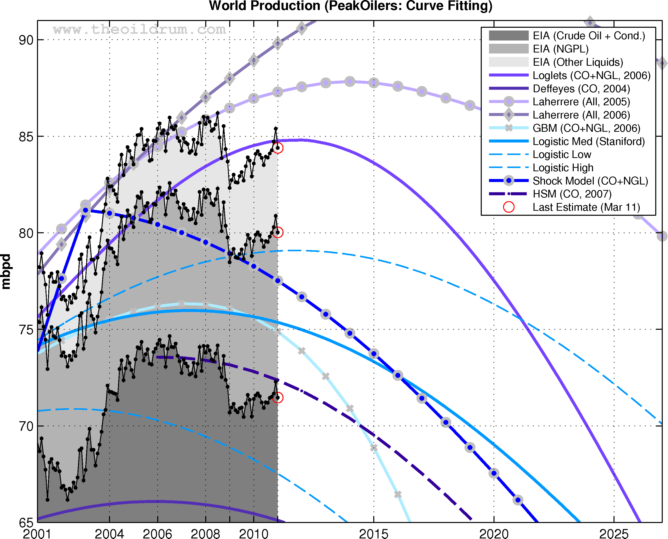
Figure 9. Peak oil forecasts based on Curve fitting.It remains to be seen what will happen in the next few months with respect to updates and corrections for both JODI and the EIA. Production levels were lower before 2005 and were never corrected to match the EIA data. If anything, it shows the large uncertainty surrounding production data coming from OPEC, the reason why OPEC members would report lower production data to JODI is unclear.
The way the production data is collected vastly differ between the EIA and JODI, for JODI the data is collected using a 42 key oil data points questionnaire. The data is then revised twice a year:
Jodi is a voluntary activity. Participating countries complete a standard data table (see table on page 2) every month for the two most recent months (M-1 and M-2) and submit it to the Jodi partner organisation(s) of which it is a member. The respective organisation compiles the data and forwards it to the IEF Secretariat which is responsible for the JodiOil World Database.
The EIA does not collect international production data but apparently pays IHS for the data (at least until the recent budget cuts).
Leave a Reply