Peak Oil is You

Donate Bitcoins ;-) or Paypal :-)
Page added on June 15, 2012
Energy Return on (Energy) Invested (EROI), Oil Prices, and Energy Transitions

The economical and sustainable provision of energy to run modern economies and meet human development goals is one of the Grand Challenges facing the world today. There is increasing evidence that the physical scarcity of fossil fuels is a serious possibility to reckon with. An important question to ask is whether price signals of physical scarcity will be sufficient to cause transitions to alternative fuel sources.
One proposed physical indicator of energy supply scarcity is energy return on (energy) invested (EROI). Little work has been done so far to model, test, and understand the relationship between oil prices and EROI over time. This post (based on our recent paper) investigates whether declining EROI is associated with increasing oil price and speculates on the implications of these results on oil policy. The questions addressed are:
- ‘‘How is EROI related to energy prices?’’
- ‘‘What implications do EROI trends over time have for economic and energy policy?’’
- ‘‘What is required to ensure a smooth transition away from oil toward substitutes?’’
We propose a physically based model of the interaction between physical scarcity and market prices, with a focus on the behaviour of EROI and oil prices over time.
Model Development
We developed a model of the relationship between EROI and energy prices of the form
Historical Trends
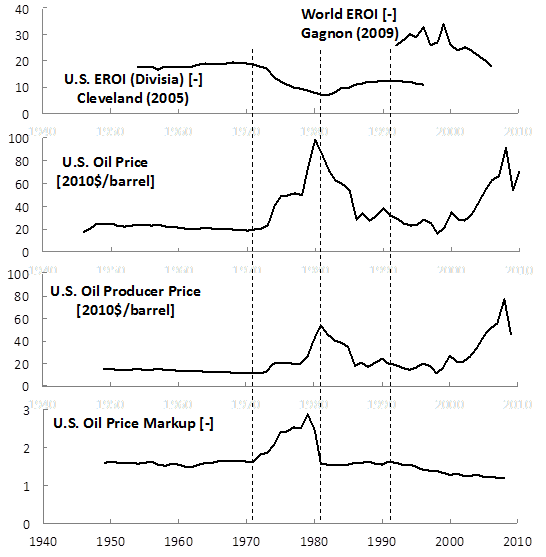
Figure 1 presents data on EROI, oil price, production cost and mark-up in an easily comparable way. Divisia-corrected EROI for the U.S. remained approximately constant from the mid- 1950s to early 1970s, declined rapidly in the 1970s and increased again in the mid-1990s. The available data indicates that EROI for the world (Gagnon et al., 2009) and the U.S. (Cleveland, 2005) are falling at the present time. The present rate of technology improvement appears to be insufficient to put oil production EROI on a positive slope with respect to time. Time series data for oil prices are available from many sources. We used inflation-adjusted data for the average U.S. oil price ($/barrel) for the period 1946–2010 as based on historical free market (stripper) prices of Illinois Crude. Producer prices for U.S. domestic oil are available from the U.S. Energy Information Agency (EIA, 2010) and show a peak in the early 1980s and a continuous rise from the early 2000s onwards.
Dividing the U.S. oil price by the U.S. producer prices provides an estimate of the oil price mark-up ratio. Over much of the period for which data are available, the mark-up ratio has been relatively constant, except for the spike in the 1970s and the recent decline since 1990. It does not appear that oil producers in the U.S. are (currently) in a position to charge a premium for ever-scarcer oil. In fact, just the opposite appears to be happening: the mark-up ratio has been trending downward over the last two decades.
EROI-Price Correlation
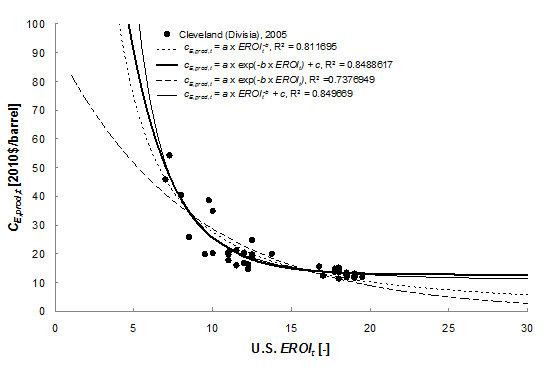
To assess the relationship between EROI and production costs (cE,prod,t), we plotted producer prices vs. EROI for the years 1954–1996. We found good inverse correlation. The graph below shows several empirical models that were evaluated statistically.
EROI Extrapolation
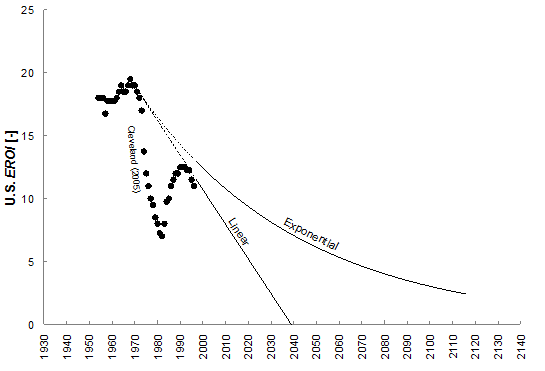
Based on the Cleveland EROI data, we can extrapolate EROI forward through time. This is, necessarily, difficult to do, thus our approach is to bound the future EROI prediction with a linear and an exponential decay function as shown in the following graph.
Oil Price Predictions
Using the best model of producer cost vs. EROI and the linear and exponential decay scenarios for the evolution of EROI with time, we can make predictions of oil prices into the future (beyond 1996, the extent of the Cleveland (2005) data).

Conclusion
One cannot take a smooth transition from oil to other forms of energy for granted. Our paper highlights four factors indicating that a smooth transition away from oil is unlikely: insufficient oil-sector technological development to overcome depletion, declining mark-up, a non-linear relationship between EROI and production costs, and the non-linear relationship between EROI and oil price. In fact, with EROI values tending downward below 10, the risk of significant increases in oil prices, all other factors constant, is very high.
Significant transitions in energy technologies are not fast. Fouquet, in a study of previous energy transitions, indicates that, historically, the time-scale for diffusion to dominance for a new energy technology is on the order of three decades for the fastest transitions.
Several policy implications, most notably to diversify away from oil toward alternative energy sources and to prepare for depletion-induced oil price shocks, lead to the conclusion that some form of management and support will be required to achieve a smooth transition away from oil. The Dutch example on energy transition management provides some experience, but more research is needed to understand how policy makers can better influence energy transitions.
For additional details, see Energy return on (energy) invested (EROI), oil prices, and energy transitions.
6 Comments on "Energy Return on (Energy) Invested (EROI), Oil Prices, and Energy Transitions"
BillT on Fri, 15th Jun 2012 3:14 pm
“… a smooth transition away from oil is unlikely …” That says it all. EROEI is the ruling factor that is being denied by the Western economists.
shortonoil on Fri, 15th Jun 2012 3:53 pm
We have also plotted world crude prices vs ERoEI and came up with a correlation coefficient of 0.947 using 1960-2009 WTI. Your main problem here is two fold: ONE – the 1980 – 1985 price data-set is an anomaly. During those years OPEC forced the price up 292% by cutting their production by almost 50%. When you linearize the ERoEI function you see a six point drop in world ERoEI after those years. This probably resulted from the non-OPEC producers over pumping their wells to capitalize on $27 oil. Even though the price distribution is not normal, the ln($/b) distribution is; you can therefore easily show that the 80 – 85 period does not belong to the same population as the balance. TWO – the ERoEI curve is not an exponential function, it is an inverse logistic function which can be derived mathematically. Even though the two distributions are similiar, their difference will affect your projections by quit a few $/b.
Our plots of actual $/b vs projected for 1960-2009 came up with a correlation coefficient of 0.96, again using WTI. Our 2012 projection is $72/b, about $15 lower than yours. Although there will be considerable resistance to it (neither the Middle East situation or the US dollar will do well) it still seems quite likely we’ll see $72 this year. Europe and China are unraveling, and the US is not about to enter a new boom era. Even OPEC in its hayday could only keep the price of oil up for so long.
On “a smooth transition from oil to other forms of energy “, we totally agree with you. Our estimate is that there is $88 trillion in oil dependent capital stock that can not be converted for use with other energy types. The economic impact is going to be tremendous no matter what other energy sources are utilized.
Overall good paper, and thanks.
The Hill’s Group
DC on Fri, 15th Jun 2012 3:59 pm
Yes three decades for the fastest transitions. I assume that to mean if the transition itself it not being actively hindered and blocked at every turn by big oil, which it is. If you combine these type of analysis with active hinderance, I think you get a lot more than 3 decades right? What that ends up telling me is, the transition wont not because it cant, but because the corporate elite dont want it no matter how badly its needed. 3 decadees becomes 4, then 5, then 6, then collapse occurs.
SOS on Fri, 15th Jun 2012 5:15 pm
Very interesting. I could agree with 72 but the increasing EROI, energy returned will be overpowering increasing costs because of cost containment and increasing supplies of high quality crude.
That means prices may even fall further than 72 in the short term. Look at gas.
anonymous on Fri, 15th Jun 2012 9:17 pm
Coal and Oil are almost equal in production and if we exclude NGL (Natural Gas Liquids) from Oil, then Coal is the new #1.
BillT on Sat, 16th Jun 2012 1:24 am
DC, I believe collapse will happen long before you do. Maybe in the next 10 years? Certainly not 3 to 6 decades. And, SOS, there is no “high quality crude” left in the world, just asphalt crud.