

By Chris Hamilton
Production of crude oil has nearly stalled despite a near quadrupling in the price since ’01 and it seems likely the world has entered the Peak Oil phase and neither the governments nor central banks (try as they may) can paper this over. Without the growing supply of adequate cheap energy, there isn’t adequate GDP growth, and without the GDP growth, there is no way to outgrow, pay off, or service the huge debts incurred but by interest rate suppression. The dual occurrence of peak oil with ZIRP (zero interest rate policy) is a truly unfortunate state of affairs. But whether or not they happened in tandem, both were inevitable. Still, governments and central banks are attempting to maintain the pre-peak oil system and avoid the pain of free market corrections to supply, production, and price. It is in this light that the centralization and “intervention” of stock, bond, and real estate markets and the manipulation of commodities growing in scale and frequency since ’09 should not be shocking. Free markets are the enemy of fraud, the punisher of bad fiscal and economic behavior and thus free markets will not be allowed to facilitate true price discovery (i.e., REALITY).
The story of energy, particularly cheap and plentiful crude oil, has been the foundation of rapid economic global growth since WWII. The Global story of crude oil is integral to understanding the world of 2014. Crude oil matters so much because there is no readily available replacement for its energy and chemical uses and any likely eventual replacement will be at significantly higher costs. Ever higher costs of energy are negatively impacting GDP growth the world over and absent GDP growth there is no way to service or grow our way out from the great debts that have been incurred.
Was 2005 the Peak for Cheap, High-Quality Oil?
Seems the world hit “peak conventional oil” or “peak high-quality, low-cost oil” about 2005 & 90%+ of all subsequent global supply increases to offset retiring low-cost, high-quality sources worldwide have been due to production gains coming from uneconomical and unsustainable US/Canadian “tight oil” and tar sands. The global production stall has been cushioned by falling US, EU, Japanese consumption allowing greater % of existing production to supply growing users like the BRICS…
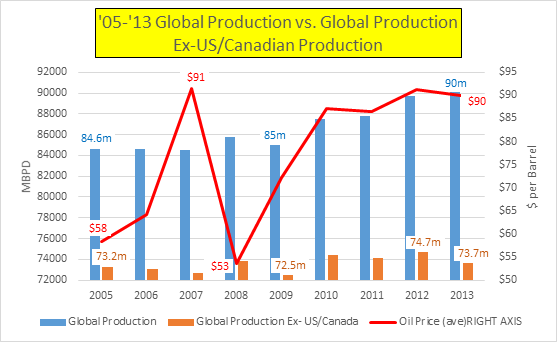
- From ’05 through ’13, Global total supply rose 5.3 mbpd (million barrels per day) or 6% (again, US / Canada “tight oil” Shale responsible for nearly all this increase) while average annual price rose 55% from $58 to $90 per barrel… with prices as high as $147/barrel along the way.
Peak oil is not the end of oil but instead as the name implies, the maximum output before the declines onset… it is marked by the rotation from high-quality, low-cost sources to higher expense, lower quality sources (requiring higher production costs in exploration, extraction, refining, etc.). Peak oil is also marked by the exploration and development of higher difficulty (Arctic, deep sea, tar sands, shale, etc.) production sources in ever more remote locations… but these will generally be inferior quality and quantity to the sources that are being retired and generally have a far shorter life cycle. Peak “exportable” oil is a further complication where-by net exporters consume ever more of their own production leaving a diminishing supply of exportable oil available to all importing nations.
A longer term perspective
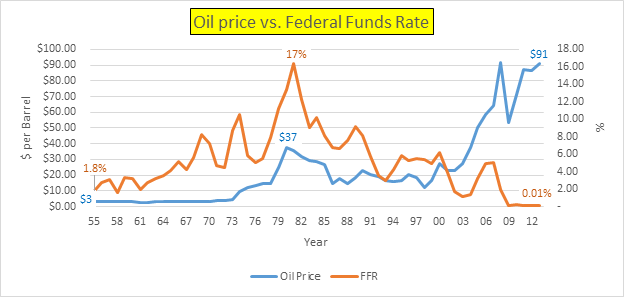
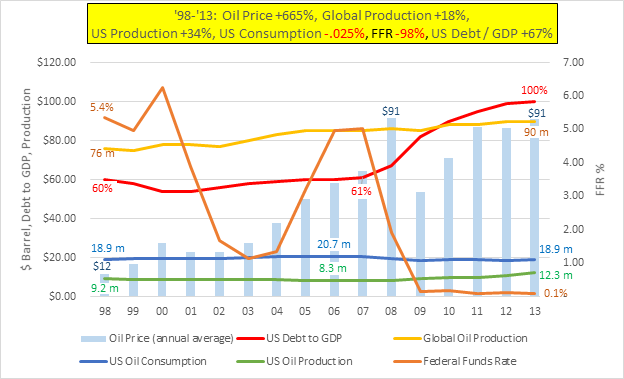
Energy prices and interest rates rose together during the 70s until 1980. Then they fell in tandem from ’80 ’til ’98. However, they dramatically diverged in 2001 never to correlate again. Energy rose from $37 to $90 and rates falling from 18% to zero. The 750% increase in energy prices since ’98 have been financed by a simultaneous 98% decrease in the Federal Funds Rate (cost of debt).
US Job Creation Collapsed in sympathy with higher energy costs!!!
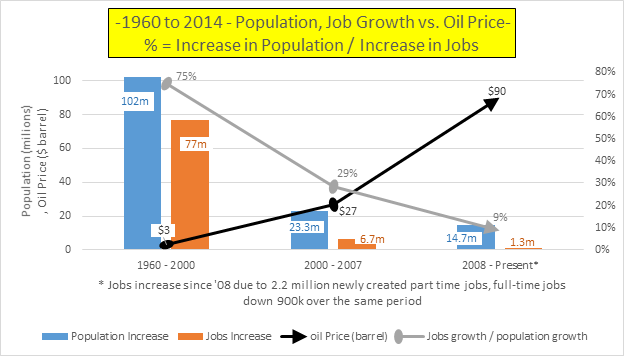
Forget UE rates or other BLS #’s. Let’s just work from raw data in the chart below… 1960 to 2000 there were 75 jobs created for every 100 gain in US population… or a ratio of 75% newly created jobs per every 100 gain in population. From 2000 to 2007 newly created jobs per population gain fell to 29%. From 2008 til present, the job creation per population growth has collapsed to 9% or 9 jobs created per every 100 new Americans!!!
But the 9% number is misleading due to the fact all job gains in this ’08-present period were part time jobs while full time jobs fell in excess of 900k over the period… if we based this on full time jobs (those with higher wages, benefits, 401k’s, etc.), the number would be negative.
The rising cost of energy throughout this period seems to tightly correlate with the collapsing job creation. There are many structural reasons for the slowing US jobs creation (technology, outsourcing, etc.) but higher costs of energy are certainly responsible for a portion of the collapse.
Noticeable below is the population growth, “not in labor force” growth, and part-time worker growth vs. the stall in the labor force, total employed, and the fall in full-time workers.

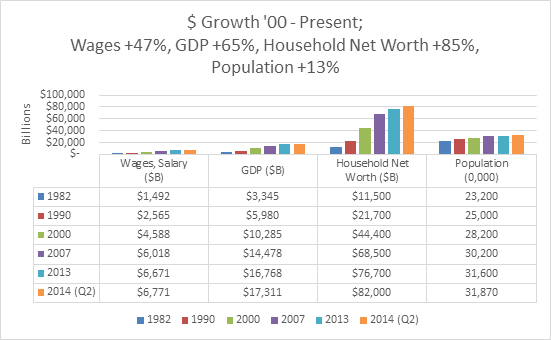
And household net worth grew almost at double the pace of Wage growth from ’00 until Present (below).
And as Energy Prices Soared, America Went Bankrupt!!!
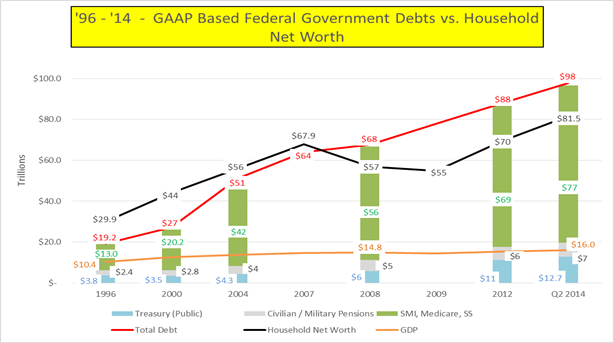
In the below chart, ’00 til present, Treasury debt and total debt (including unfunded liabilities) grew +265% while Household Net Worth grew +85%, and GDP grew about +30%. America’s total debt now exceeds its GDP by +500%, up from +115% in ’00. And, btw, America went bankrupt in ’07, when liabilities surpassed assets.
Breaking it down…
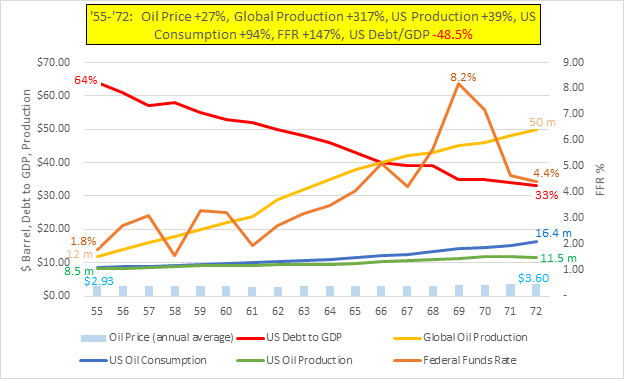
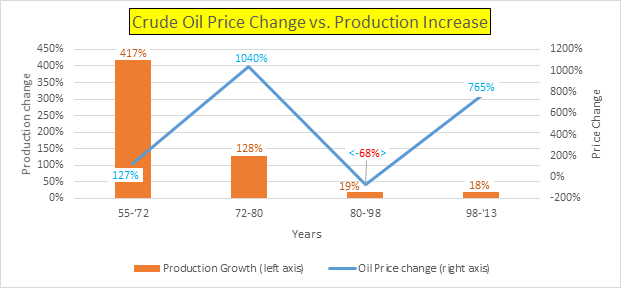
- ’55 to ’72 was the golden economic age in postwar America; the cost of energy was stable in a tight range, FFR rose gently across the period, Debt to GDP fell from over 100% in ’48 to 33% by ’72 (remember, the US ran no budget federal budget deficits from ’48 til ’57 and GDP doubled in that time).
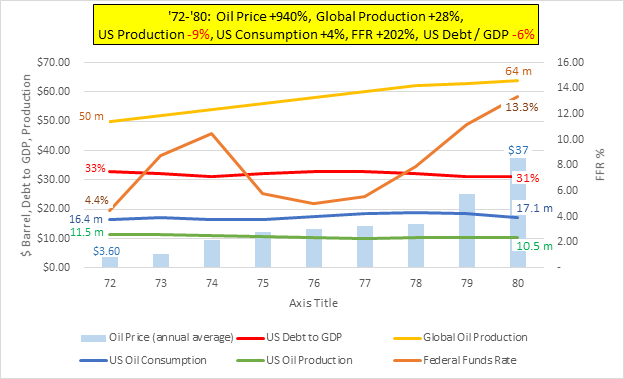
- ’72 to ’80 sees the good work of the previous two decades reversed; energy prices skyrocket, US energy production begins a long fall, rising debt is masked by the Unified Budget accounting fraud, and US interest rates rise for the final prolonged period.
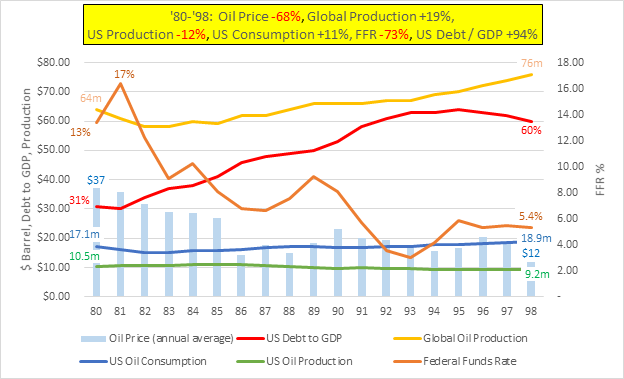
- No wonder the ’80s and ’90s were so good to the markets; Who remembers the price of oil fell consistently from 1980 until 1998 by a total of 68%, Fed’s Fund Rate fell by 73%, and national debt doubled. Good times!!!
- But things turned nasty in the ’00s; energy prices skyrocketed while production is moribund, interest rates bottom out at zero, and Debt to GDP returns to WWII levels.
And what would ’14-’24 look like? Most likely continued declining oil production, higher energy costs, and more debt.
Oil Production Close-Up
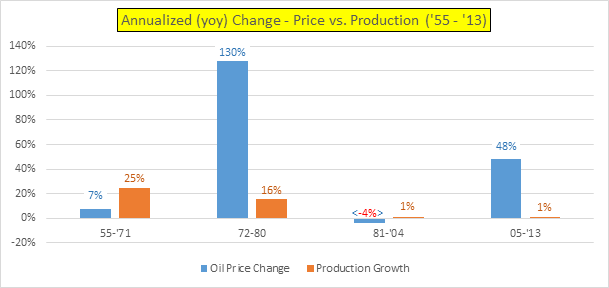
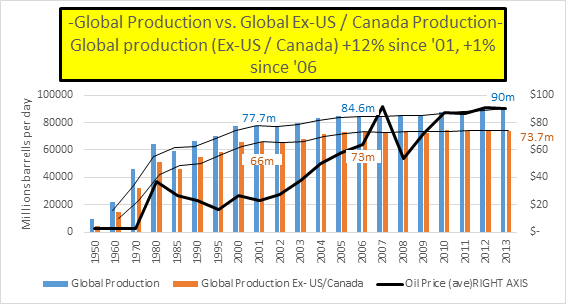
Here’s the strongest evidence of peak oil. Despite the massive price increases, the rise in global oil production since ’98 has been anemic… oil production has only minimally responded to higher prices.
Global production added approximately 1% annually to production… the same amount that was added annually from ’81 to ’98 when energy prices fell 68%.
Or more pointedly, global production is barely able to offset the conventional production losses with new production… despite the growing demand and massive price hike which should draw all available production to the market.
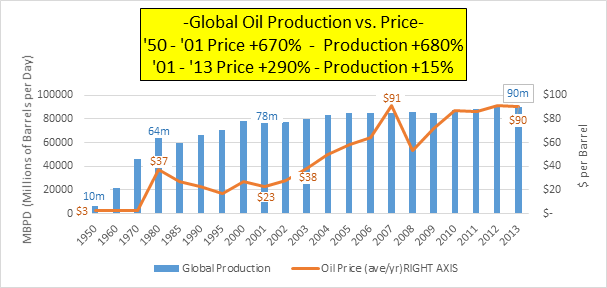
The below chart tracks the rising price and production of global crude oil from 1950 til 2013. A 770% rise in price was met w/ a 780% production increase from ’50-’01. However, since ’01, a 290% price increase resulted in only a 15% production increase (all prices are average annual crude oil prices in $’s and global production numbers).
Global Crude Oil Supply and Demand – Asia, Europe, N. America importers… Middle East / Eurasia / Africa exporting.
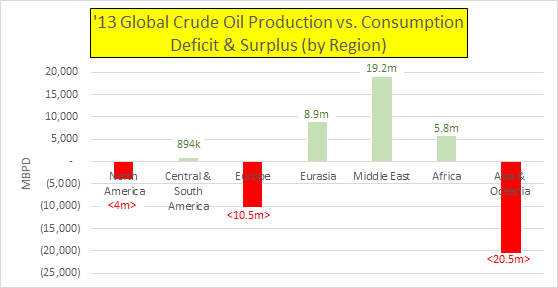
2000 through 2013 oil production and consumption trends…
- N. America – Production rising, consumption falling
- Eurasia and Middle East – Production rising, consumption rising
- Asia – Production flat, consumption rising
- S. America – Production rise, consumption rise
- Europe – Production collapsing, consumption falling
- Africa – Production flat, consumption rising
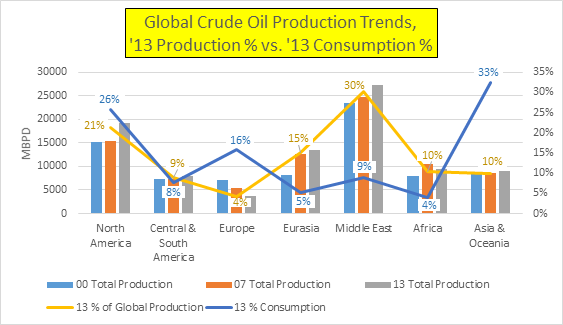
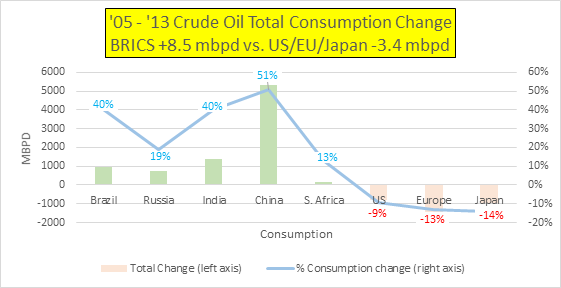
Consumption – US and EU both peak in oil consumption in ’05, Japan peaked in ’96 and has continued falling 20.5% since. Falling total energy usage seems to imply an ongoing depression. However, BRICS are all showing growth and at record consumption in ’13.
Production – Crude oil production growth in US / Canada accelerate while remainder of the world slowing production despite the near tripling of average prices over the 3 periods.
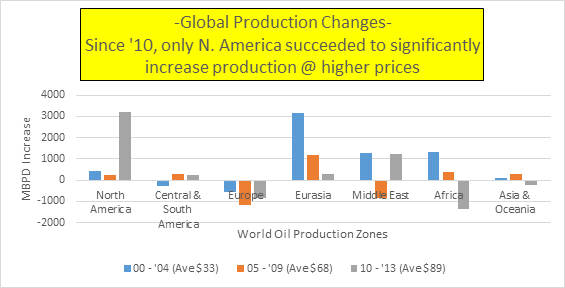
Focus on N. America (US / Canadian) production gains and consumption decline
Only US and Canada found the capability to significantly increase production at higher prices!
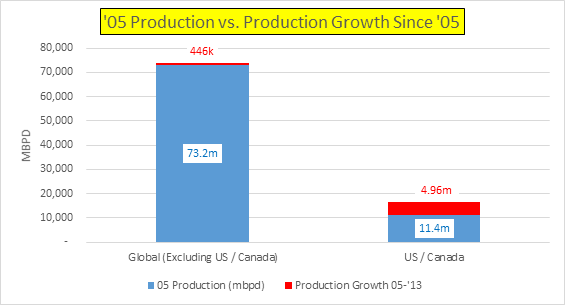
- Total global oil production growth since ’05 slowed to less than 1% (yoy), less than half the pace of previous periods since WWII… but it wasn’t an across the board slowdown despite across the board price increases of 160% (400%-650% since ’01)
- Global production Excluding US / Canada stalls
- Global production excluding US / Canada production (representing 86% of ’05 global production), increased by 446 thousand barrels per day over 8 years or 56 thousand barrels (yoy), a .006% increase annually (6 one hundredths of 1%).
-US / Canadian production significantly accelerates
-US / Canada production representing 14% of total ’05 global production, US / Canada production grew 4.9 mbpd or 620 thousand barrels a day (yoy).
The below chart shows combined US / Canadian production bottom in ’05, stagnate til year end ’08 when a rapid acceleration in production takes effect.
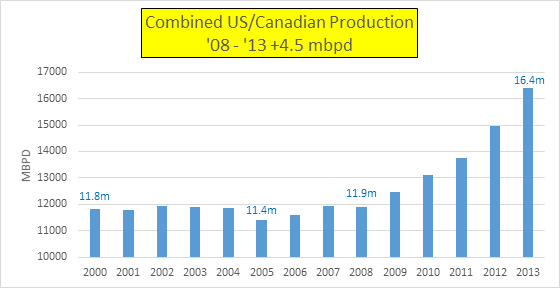
Nearly all production gains from ’05 ’til present are due to US / Canadian growth.
Source eia.gov
How did US and Canada Increase Production?
Production growth in America is from “Tight Oil” while Canada is a combination of tight oil and tar sands.
US
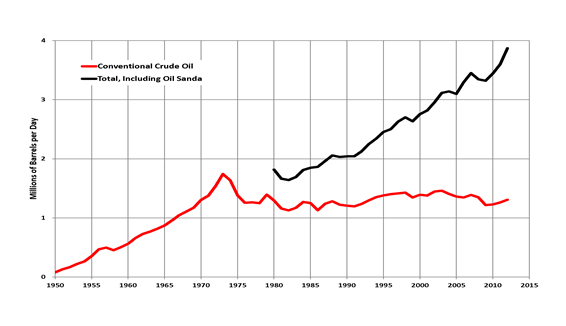
Canada – Tar Sands + Tight Oil
What is “Tight Oil”? Tight oil is generally production using hydraulic fracturing, generally in shale formations, often using the same horizontal well technology used in the production of shale gas. These new sources of oil are generally low quality, high cost, and generally short in duration.
The new tight oil crude is much lighter than traditional crude. According to the Wall Street Journal, the expected split of US crude is as follows:
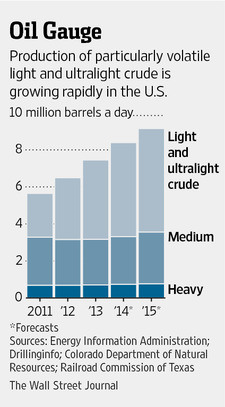
There are many issues with the new “oil” production:
- The new oil production is so “light” that a portion of it is not what we use to power our cars and trucks. The very light “condensate” portion (similar to natural gas liquids) is especially a problem.
- Oil refineries are not necessarily set up to handle crude with so much volatile materials mixed in. Such crude tends to explode, if not handled properly.
- These very light fuels are not very flexible, the way heavier fuels are. With the use of “cracking” facilities, it is possible to make heavy oil into medium oil (for gasoline and diesel). But using very light oil products to make heavier ones is a very expensive operation, requiring “gas-to-liquid” plants.
- Because of the rising production of very light products, the price of condensate has fallen in the last three years. If more tight oil production takes place, available prices for condensate are likely to drop even further. Because of this, it may make sense to export the “condensate” portion of tight oil to other parts of the world where prices are likely to be higher. Otherwise, it will be hard to keep the combined sales price of tight oil (crude oil + condensate) high enough to encourage more tight oil production.
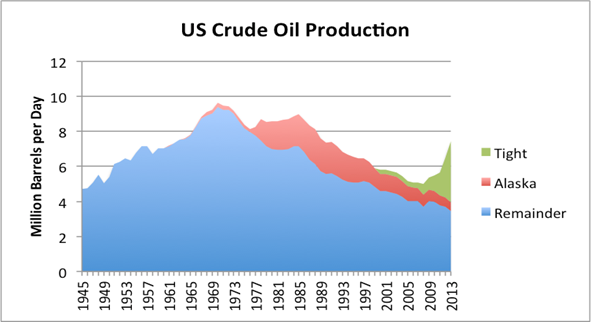
2009 through 2013 saw a rapid increase in US production, almost entirely from low quality, high cost new tight oil sources while conventional high-quality, low-cost production maintained its long, gradual decline.
How sustainable and profitable is this new “Tight Oil”?
From SRS Rocco…
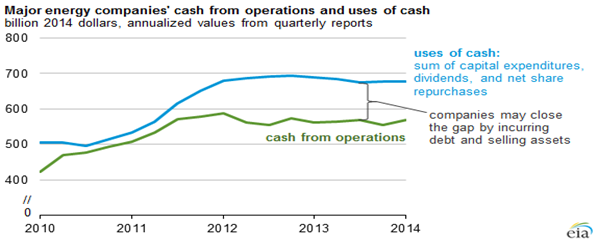
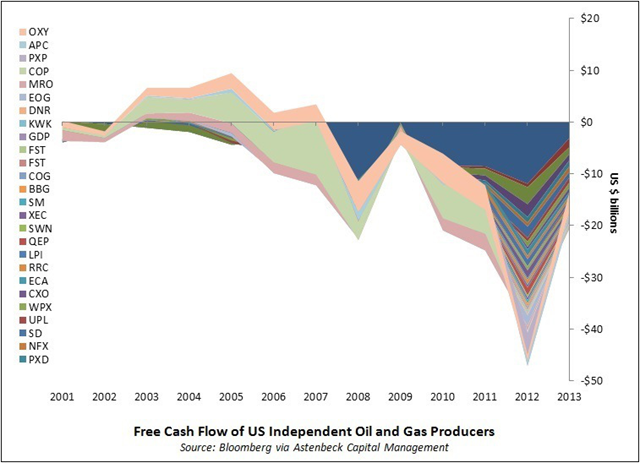
In 2010, the hole left behind by fracking was only $18 billion. During each of the last three years (’11-’13), the gap was over $100 billion/yr. This is the chart of an industry with apparently steep and permanent negative free cash-flows: This is the huge problem with Fracking shale oil and gas. Due to the extremely high annual decline rates of the typical shale oil or gas well, companies must continue to spend a great deal of capital expenditures to replace what was lost. It’s known as the DRILLING TREADMILL… once you start, you can’t get off.
In one year the top 127 oil and gas companies spent $110 billion more on capital expenditures than they received from operations. So, they acquired $106 billion in additional debt (a large percentage through the Junk Bond Market) and sold assets to make up the difference.
This is not a sustainable business model, just like the same nonsense taking place in the broader stock markets as corporations buy back massive amounts of their stock to give the ILLUSION that everything is fine and BAU- Business As Usual will continue.
Not only are many of these oil and gas companies hiding the fact that their balance sheets are hemorrhaging debt, they also have a cozy situation with the Federal Government. Basically, the Fed’s allowed them to defer more than half of their tax bill… and it’s a lot of money. In a nutshell, the top 20 oil and gas companies still owe $16.5 billion (more than 50%) to Uncle Sam in tax revenue.
Conclusion –
It appears the world hit peak cheap, high-quality oil sometime in ’05 and the fallout since has been spectacular financial chaos. Declining GDP “growth”, money printing gone wild, ZIRP and NIRP activated, all since adequate supplies of newly available cheap energy failed to offset the declining conventional production. And the US / Canada low quality, high cost, unsustainable shale “miracle” signals the death throes of a global economy entirely dependent on cheap energy for growth and service of peak debt.
And the current path of deceit, QE, and command economies will only further what ails us enriching ever fewer at the expense of ever more. Shale oil and oil in general is finite and should be priced accordingly… and we should adjust.
There are solutions to the problems which ail us… not easy solutions, but genuine solutions nonetheless. But prior to talk of solutions, a consensus that there is a problem is necessary. I don’t write any of this to prove we are doomed… to the contrary I write with the hope that an informed, aware citizenry reacquainted with reality can do what’s it’s done throughout history when faced with adversity; come together for a brighter future.
Postscript
• June ’04 to Nov ’10 oil (monthly closes) traded between $42-$85/barrel for all but 12 months (’07-’08 super spike).
• Nov ’10 til present monthly average was above $85 in every month but one (Aug ’11 @$79)… 46 months straight above $85.
• Noteworthy is the 10 month oil price moving average… We set a new record high for the previous 10 month period in June ’14 @ $99… higher than the $98.5 peak of ’08. The economic strains associated with such a prolonged period of historically elevated prices have typically led to recessionary reactions. If the traditional pattern plays out, we are likely to see one to three months of spike lows below $85 but maintaining $85 on the monthly closes (like we saw in ’08 @ $42)… and once that is complete and $85 is confirmed as the new “floor”, significantly higher prices would seem likely.. probably in conjunction with new QE or stimulus programs.
Northwest Resident on Wed, 15th Oct 2014 2:03 pm
“spectacular financial chaos” since 2005?
You ain’t seen nothin’ yet.
Great summarization of what got us to where we are now. It is the most intense drama in human history now playing out, the final act before the curtain falls.
MSN Fanboy on Wed, 15th Oct 2014 2:04 pm
All roads lead to collapse at this point. Its all reversing.
Foolish, we could have prevented the next twist in human history. Pity.
tahoe1780 on Wed, 15th Oct 2014 4:52 pm
Comment from original Seeking Alpha article:
Jeffrey J. Brown
Comments (15)
| + Follow | Send Message
Peak (Crude) Oil in 2005?
In my opinion it is very likely that actual global crude oil production (45 or lower API gravity crude oil) peaked in 2005, while global natural gas production and associated liquids (condensates & natural gas liquids) have so far continued to increase.
I’ve always thought it odd that when we ask for the price of oil, we get the price of 45 or lower API gravity crude oil, but when we ask for the volume of oil, we get some combination of crude oil + condensate + NGL (Natural Gas Liquids) + biofuels + refinery gains.
This is analogous to asking a butcher for the price of beef, and he gives you the price of steak, but if you ask him how much beef he has on hand, he gives you total pounds of steak + roast + ground beef. Shouldn’t the price of an item directly relate to the quantity of the item being priced, and not to the quantity of the item plus the quantity of (partial) substitutes?
In any case, the closest measure of global crude oil production that we have is the EIA data base that tracts global Crude + Condensate (C+C). In regard to this data base, a key question is the ratio of global condensate to C+C production. Unfortunately, we don’t appear to have any global data on the Condensate/(C+C) Ratio. Note that when the EIA discusses “crude oil” they are talking about C+C.
Insofar as I know, the only complete Condensate/(C+C) data base, from one agency, is the Texas RRC data base for Texas, which showed that the Texas Condensate/(C+C) ratio increased from 11.1% in 2005 to 15.4% in 2012. The 2013 ratio (more subject to revision than the 2012 data) shows that the 2013 ratio fell slightly, down to about 15%, which probably reflects more focus on the crude oil prone areas in the Eagle Ford. The EIA shows that Texas marketed gas production increased at 5%/year from 2005 to 2012, versus a 13%/year rate of increase in Condensate production. So, Texas condensate production increased 2.6 times faster than Texas marketed gas production increased, from 2005 to 2012.
The EIA shows that global dry gas production increased at 2.8%/year from 2005 to 2012, a 22% increase in seven years.
If the increase in global condensate production only matched the increase in global gas production, global condensate production would be up by 22% in seven years. If global condensate production matched the 2005 to 2012 Texas rates of change (relative to the global increase in gas production), global condensate production would be up by about 67% in seven years.
In any case, we don’t know by what percentage that global condensate production increased from 2005 to 2012. What we do know is that global C+C production increased at only 0.4%/year from 2005 to 2012.
In my opinion, the only reasonable conclusion is that rising condensate production accounted for virtually all of the increase in global C+C production from 2005 to 2012, which implies that actual global crude oil production was flat to down from 2005 to 2012, as annual Brent crude oil prices doubled from $55 in 2005 to $112 in 2012.
The following chart shows normalized global gas, NGL and C+C production from 2002 to 2012 (2005 values = 100%).
http://bit.ly/11oGXEu
The following chart shows estimated normalized global condensate and crude oil production from 2002 to 2012 (2005 values = 100%). I’m assuming that the global Condensate/(C+C) Ratio was about 10% for 2002 to 2005 (versus 11% for Texas in 2005), and then I (conservatively) assume that condensate increased at the same rate as global gas production from 2005 to 2012, which is a much lower rate of increase in condensate (relative to the increase in gas production) than what we saw in Texas from 2005 to 2012.
http://bit.ly/11oGXEw
Based on foregoing assumptions, I estimate that actual annual global crude oil
production (45 or lower API gravity crude oil) increased from about 60 mbpd
(million barrels per day) in 2002 to about 67 mbpd in 2005, as annual Brent
crude oil prices doubled from $25 in 2002 to $55 in 2005.
At the (estimated) 2002 to 2005 rate of increase in global crude oil production,
global crude oil production would have been up to about 90 mbpd in 2013.
As annual Brent crude oil prices doubled again, from $55 in 2005 to an average
of about $110 for 2011 to 2013 inclusive, I estimate that annual global crude
oil production did not materially exceed about 67 mbpd, and probably
averaged about 66 mbpd for 2006 to 2013 inclusive.
Northwest Resident on Wed, 15th Oct 2014 5:09 pm
“In my opinion, the only reasonable conclusion is that rising condensate production accounted for virtually all of the increase in global C+C production from 2005 to 2012, which implies that actual global crude oil production was flat to down from 2005 to 2012, as annual Brent crude oil prices doubled from $55 in 2005 to $112 in 2012.”
Heavy duty implications, if true, and I suspect it is very close to the truth.
JuanP on Wed, 15th Oct 2014 6:24 pm
NR, I agree. That observation is probably very close to the truth. To the best of my knowledge that statement is accurate.
tahoe1780 on Wed, 15th Oct 2014 6:48 pm
https://rbnenergy.com/dont-let-your-crude-oil-grow-up-to-be-condensate