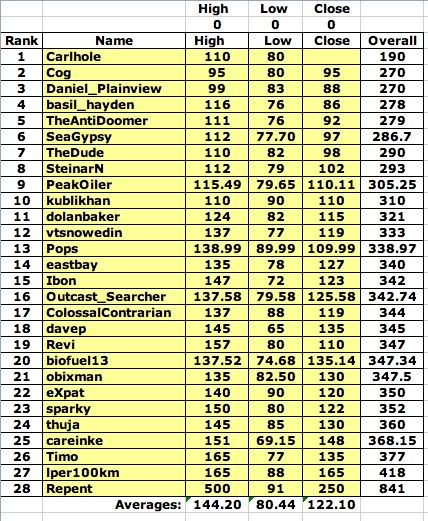
High: $135
Low: $78
Close: $127


PeakOil is You
The 2011 PO.com Oil Price Challenge
Re: The 2011 PO.com Oil Price Challenge
![]() by eastbay » Sun 26 Dec 2010, 22:43:22
by eastbay » Sun 26 Dec 2010, 22:43:22
Got Dharma?
Everything is Impermanent. Shakyamuni Buddha
Everything is Impermanent. Shakyamuni Buddha
-

eastbay - Expert

- Posts: 7186
- Joined: Sat 18 Dec 2004, 04:00:00
- Location: One Mile From the Columbia River
Re: The 2011 PO.com Oil Price Challenge
![]() by Revi » Sun 26 Dec 2010, 22:56:33
by Revi » Sun 26 Dec 2010, 22:56:33
I'm going to go with a high of $157, because we might get to it this year.
A low of $80 and a closing price of $110.
It seems like we may have something happen during the course of 2011 that could drive the price up, and $10 more than the last all time high would be about right.
That's my WAG.
A low of $80 and a closing price of $110.
It seems like we may have something happen during the course of 2011 that could drive the price up, and $10 more than the last all time high would be about right.
That's my WAG.
Deep in the mud and slime of things, even there, something sings.
-

Revi - Light Sweet Crude

- Posts: 7417
- Joined: Mon 25 Apr 2005, 03:00:00
- Location: Maine
Re: The 2011 PO.com Oil Price Challenge
![]() by lper100km » Mon 27 Dec 2010, 02:06:13
by lper100km » Mon 27 Dec 2010, 02:06:13
Here’s my WAG
High $165
Low $88
Close $165
High $165
Low $88
Close $165
-

lper100km - Lignite

- Posts: 397
- Joined: Mon 05 Jun 2006, 03:00:00
- Location: Over the tracks, left under the overpass, right, third boxcar on the left, ask for Jack
Re: The 2011 PO.com Oil Price Challenge
![]() by kublikhan » Mon 27 Dec 2010, 05:22:46
by kublikhan » Mon 27 Dec 2010, 05:22:46
$this->bbcode_second_pass_quote('pup55', 'B')y all means. If the PO.com news sleuths come across some "expert estimates" feel free to post them. Since they do not usually give the high, low and close, we can't really add them in the standings.....
Here is an EIA estimate that predicts the price for every month of 2011. I simplified it into low, high, and close:EIA Low: $84
EIA High: $89
EIA Close: $89
EIA Short Term Energy Outlook
Goldman Sachs has a detailed breakdown as well. Here it is simplified into low, high, and close[brent]:
Goldman Sachs Low: $91
Goldman Sachs High: $107
Goldman Sachs Close: $107
Goldman Sachs Crude Oil Prediction for 2011
Is Brent usually $2 higher than WTI? Perhaps these should be adjusted down $2 to convert to WTI.
The oil barrel is half-full.
-

kublikhan - Master Prognosticator

- Posts: 5064
- Joined: Tue 06 Nov 2007, 04:00:00
- Location: Illinois
Re: The 2011 PO.com Oil Price Challenge
![]() by dolanbaker » Mon 27 Dec 2010, 05:38:43
by dolanbaker » Mon 27 Dec 2010, 05:38:43
$this->bbcode_second_pass_quote('kublikhan', ' ')
Is Brent usually $2 higher than WTI? Perhaps these should be adjusted down $2 to convert to WTI.
Is Brent usually $2 higher than WTI? Perhaps these should be adjusted down $2 to convert to WTI.
It would be better to choose a percentage difference, rather than a fixed price for the conversion factor.
Religion is regarded by the common people as true, by the wise as false, and by rulers as useful.:Anonymous
Our whole economy is based on planned obsolescence.
Hungrymoggy "I am now predicting that Europe will NUKE ITSELF sometime in the first week of January"
Our whole economy is based on planned obsolescence.
Hungrymoggy "I am now predicting that Europe will NUKE ITSELF sometime in the first week of January"
-

dolanbaker - Intermediate Crude

- Posts: 3855
- Joined: Wed 14 Apr 2010, 10:38:47
- Location: Éire
Re: The 2011 PO.com Oil Price Challenge
![]() by TheAntiDoomer » Mon 27 Dec 2010, 09:21:42
by TheAntiDoomer » Mon 27 Dec 2010, 09:21:42
High: 111
Low: 76
Close: 92
Low: 76
Close: 92
"The human ability to innovate out of a jam is profound.That’s why Darwin will always be right, and Malthus will always be wrong.” -K.R. Sridhar
Do I make you Corny?
"expect 8$ gas on 08/08/08" - Prognosticator
Do I make you Corny?
"expect 8$ gas on 08/08/08" - Prognosticator
-

TheAntiDoomer - Heavy Crude

- Posts: 1556
- Joined: Wed 18 Jun 2008, 03:00:00
Re: The 2011 PO.com Oil Price Challenge
![]() by pup55 » Mon 27 Dec 2010, 09:28:41
by pup55 » Mon 27 Dec 2010, 09:28:41
$this->bbcode_second_pass_quote('', 'A') Reuters poll forecast oil prices will average over $86 a barrel next year on declining inventories and demand growth from Asia.
$this->bbcode_second_pass_quote('', 'h')ttp://www.saudigazette.com.sa/index.cfm?method=home.regcon&contentID=2010122289756
$this->bbcode_second_pass_quote('', '
')Societe Generale cut its oil price forecast for next year to $85 a barrel from $92 as demand growth slows and production outside OPEC expands.
http://www.arabianbusiness.com/societe-generale-cuts-2011-oil-price-forecast-by-7--85-350023.html
$this->bbcode_second_pass_quote('', 'O')n Monday a senior Saudi Arabian oil official said that oil prices should remain between $70 and $80 a barrel. A week earlier, Saudi Oil Minister Ali Naimi told an audience in Singapore prices could rise to as high as $90 a barrel.
2011 May See Return to $100 Oil
However, most analysts believe that oil prices will head higher into 2011, through a combination of stronger crude oil demand and a weaker US dollar. Bank of America and Morgan Stanley analysts both estimate oil prices will hit $100 a barrel in 2011.
http://www.liveoilprices.co.uk/oil/oil_prices/11/2010/brent-oil-price-nears-90-trading-forecast-maybe-higher.html
$this->bbcode_second_pass_quote('', 'L')eading energy analyst Phil Flynn argues that quantitative easing (money printing) is to blame for higher oil prices and stresses that the US Fed has been protecting the price of oil to support the idea that the economy is improving. Bearish in his beliefs, Flynn does does not think the market can bear $100 oil, despite other predictions.
“We heard from oil tycoon T. Boone Pickens in January predict a return to $100 a barrel, and Barclays prediction in April, and the perennial bulls Goldman Sachs with the latest call. Yet despite strong rallies, oil has fallen short of $100 and in fact, we have risked on more than one occasion a major sell off in oil prices.” said energy analyst Phil Flynn.
http://www.liveoilprices.co.uk/oil/oil_prices/12/2010/brent-oil-price-closes-over-91-mark-100-oil-for-2011.html
Flynn, as we all remember, predicted the collapse of oil prices for about 18 months, starting in 2007, while the market set record after record, in all probability losing a lot of money for his clients until he was proven "right" in mid-2008.....
$this->bbcode_second_pass_quote('', 'O')il prices are most likely to approach $ 100 per barrel (dpb) in 2011, according to latest forecast from Centre for Global Energy Studies (CGES). In its latest monthly world oil report obtained by IRNA, the London-based center predicted in its reference


 I am going to give the low more wiggle this time.