

Jeffrey J. Brown

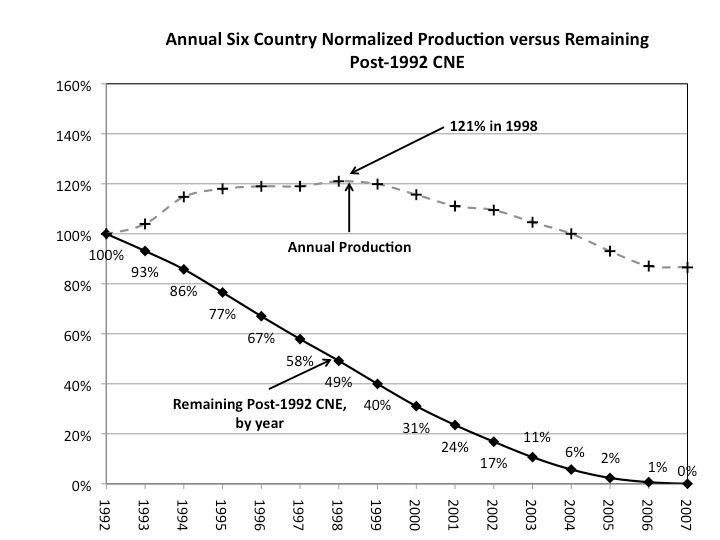
And following is my favorite (Six Country Case History) example of the disconnect between the top line production number and the bottom line CNE (Cumulative Net Exports) depletion number. The Six Country Case History consists of the six major net oil exporters, excluding China, that hit or approached zero net oil exports from 1980 to 2011.
Following is a draft of a chart that focuses on the 1995 to 2002 data for the Six Country Case History:
Normalized Production, ECI Ratio, Annual Net Oil Exports and Remaining Post-1995 CNE by year (1995 values = 100%), for 1995 to 2002 For the Combined Production and Consumption Numbers for the Six Country* Case History:
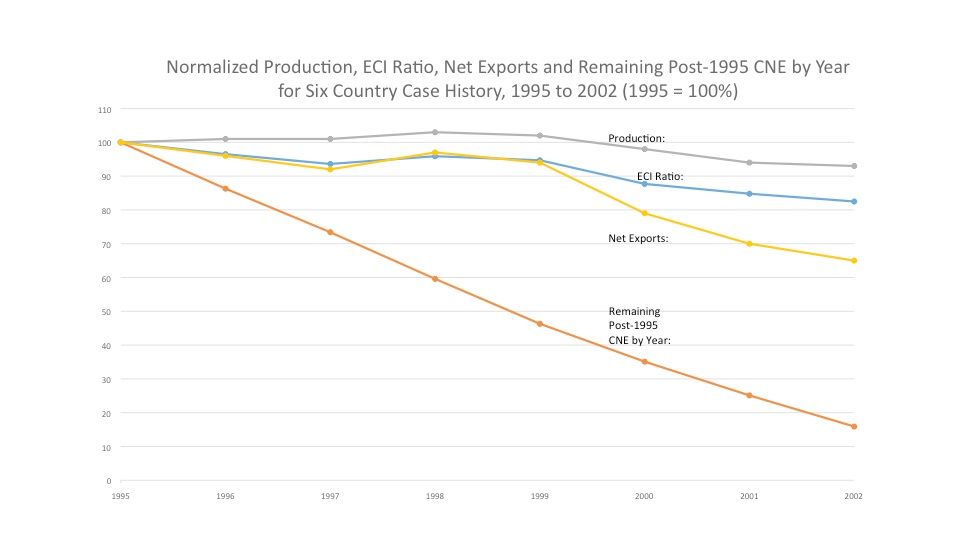
Here are the Six Country 2002 Values (as a percentage of 1995 values):
Production: 93%
ECI Ratio: 83%
Net Exports: 65%
Remaining CNE: 17%**
*Six major net oil exporting countries that, from 1980 to 2011, have hit or approached zero net oil exports, excluding China: Indonesia, UK, Egypt, Vietnam, Argentina, Malaysia
**Estimated Remaining Post-1995 CNE, at the end of 2002 were 31%, based on extrapolating 1995 to 2002 rate of decline in the ECI ratio
ECI (Export Capacity Index) Ratio = Ratio of Total Petroleum Liquids Production to Liquids Consumption
CNE = Cumulative Net Exports of oil
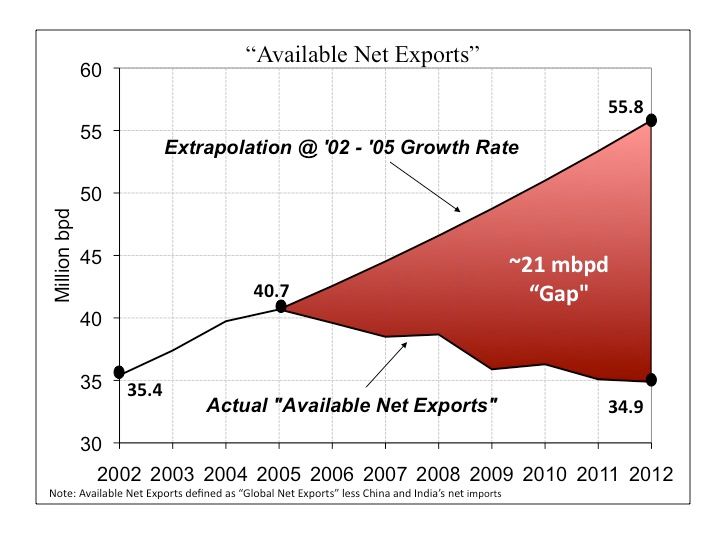
And here are some similar global data (top 33 net oil exporters in 2005) for the 2005 to 2012 time period:
Normalized Production, ECI Ratio, Annual Net Oil Exports and Remaining Post-2005 CNE by year (2005 values = 100%), for 2005 to 2012 For the Combined Production and Consumption Numbers for the Top 33 Net Oil Exporters in 2005 (Global Net Exports, or GNE):
2012 Values (as a percentage of 2005 values):
Production: 102%
ECI Ratio: 87%
Net Exports: 96%
Est. Remaining Post-2005 CNE: 79%*
*As noted above, a similar estimate, using the seven year decline in the ECI ratio, was too optimistic for the Six Country Case History.
