Casey's point of view. Although he is light on his numbers, I think. $this->bbcode_second_pass_quote('', 'T')he Government’s Big Secret
Dear Reader,
The federal government’s big secret isn’t that its spendthrift ways are destroying the country; it’s that it knows its spendthrift ways are destroying the country and it’s doing absolutely nothing to remedy the situation. In fact, all recent government action has exacerbated the decline. And it knows that too.
For instance, “The 2009 Annual Report of the Board of Trustees of the Federal Old-Age and Survivors Insurance and Federal Disability Insurance Trust Funds” (link here) reports, in black and white, that the Social Security unfunded liability is a whopping $15.1 trillion. Furthermore, the “2009 Annual Report of The Board of Trustees of The Federal Hospital Insurance and Federal Supplementary Medical Insurance Trust Funds” (link here) reports that the Medicare unfunded liability is an even more staggering $36.4 trillion.
These “trustees,” mind you, are not some outside government watchdog group either. The Managing Trustee of both boards is none other than Secretary of the Treasury Tim Geithner. And if Geithner’s aware of the situation, you know Obama and Congress are, yet you never hear anything about this reported in the mainstream media. What you get instead is pushed-through health care legislation that will add even more costs to Medicare – and the mainstream media cheers.
Want more? The 254-page “2009 Financial Report of the United States Government,” which is produced by the Treasury Department, is full of goodies illustrating just how deep in the quagmire we are.
Check out the chart below, which shows the government’s projection of debt held by the public in relation to GDP. And keep in mind that this is not what’s called the “National Debt,” which includes intragovernmental debt but just what can be considered “net debt,” or debt held by the public.
[Note: Debt held by the public is all the federal debt held by individuals, corporations, state or local governments, foreign governments, and other entities outside the U.S. Government. Intra-governmental debt is the Government Account Series securities held by government trust funds, revolving funds and other special funds, which are generally required to invest in U.S. Treasury securities. The federal government competes with private industry for credit, therefore the level of debt held by the public shows how much of the nation’s wealth has been absorbed by federal government expenditures. Interest on the public debt is a direct expense of the taxpayers paid in cash by the Treasury. Intragovernmental debt and its interest, on the other hand, aren’t necessarily paid in cash from the current budget. Instead, it often represents a liability on a future budget until the government agency holding the debt needs to cash it in (i.e. when the baby boomer social security payments come rolling in).]


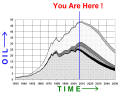
PeakOil is You
Most Important Chart of the Century
Re: Most Important Chart of the Century
![]() by deMolay » Sun 28 Mar 2010, 12:40:49
by deMolay » Sun 28 Mar 2010, 12:40:49
"We Are All Travellers, From The Sweet Grass To The Packing House, From Birth To Death, We Wander Between The Two Eternities". An Old Cowboy.
-

deMolay - Intermediate Crude

- Posts: 2671
- Joined: Sun 04 Sep 2005, 03:00:00
Re: Most Important Chart of the Century
![]() by Tyler_JC » Sun 28 Mar 2010, 17:52:14
by Tyler_JC » Sun 28 Mar 2010, 17:52:14
Newfie,
I think the US is going to have another quarter or two of sharp GDP growth (like we had last quarter) and then dip again into very slow growth if not outright recession. The short term boost from the stimulus is fading out and the productive capacity of the US economy has been permanently damaged. It will take years for the real estate agents and construction workers to be retrained for new jobs. The next 5 years will be a period of stagnation and relative decline. But not an outright collapse.
It all depends on how the Federal government decides to handle its budget deficit.
The government has seen its debt service payments as a share of GDP actually decline thanks to unnaturally low interest rates. That's why we haven't seen a collapse. If interest rates shoot up to levels last seen in the 1980s, we could see a dramatic decline in American power as military budgets are slashed to pay interest.
If net interest payments are larger than GDP growth, we will fall into a debt trap like the one Greece is trapped in. I think the long run growth potential of the US is less than 3% so that's the number I'd watch.
When the US starts to spend more than 4%-5% of its GDP on net interest payments, international investors will get nervous.
But again, all of this depends on what the federal government decides to do after about 2013-2014.
We are likely to attempt to inflate our way out of the debt, much like we did in the 1930s.
"www.peakoil.com is the Myspace of the Apocalypse."
- Tyler_JC
- Expert

- Posts: 5438
- Joined: Sat 25 Sep 2004, 03:00:00
- Location: Boston, MA
Re: Most Important Chart of the Century
![]() by lowem » Sun 28 Mar 2010, 21:57:09
by lowem » Sun 28 Mar 2010, 21:57:09
The LEI (Leading Economic Indicators) seem to be rolling over, that may lend some credence to the report. What I'm really curious is, if Zero Hour has not occurred over the past 50-60 years, what's going to happen next. And then we're off to our old questions of how big the crash, and how fast. Meanwhile back in the markets, Apr-May 2010 are certainly shaping up to be "interesting times".
-
lowem - Expert
- Posts: 1901
- Joined: Mon 19 Jul 2004, 03:00:00
- Location: Singapore
Re: Most Important Chart of the Century
![]() by Newfie » Wed 31 Mar 2010, 07:55:46
by Newfie » Wed 31 Mar 2010, 07:55:46
Tyler,
I have some confusion over your statements. To me they sound contradictory.
My thought was that we would try to "inflate" our way out of the debt. But does that not lead to higher interest payments.
And I don't understand how higher interest (inflation?) causes debt payments to increase - unless you are accruing new debt. For example, if I mortgage a house for $100,000 @10% then if inflation goes up I'm paying the house loan (made with expensive bucks) back with cheap bucks. Assuming my earning power inflates in pace with overall inflation I'm paying back with cheap bucks.
In any case I read you as saying collapse is not certain but remains possible. There may be a way out, if we are careful.
When going through hell, keep going! Churchill
Nothing is ever lost by courtesy. It is the the cheapest of pleasures, costs nothing, and conveys much. E Wiman
I know there’s no solution, so I just enjoy what’s here and I enjoy the journey G Carlin
Nothing is ever lost by courtesy. It is the the cheapest of pleasures, costs nothing, and conveys much. E Wiman
I know there’s no solution, so I just enjoy what’s here and I enjoy the journey G Carlin
-

Newfie - Forum Moderator

- Posts: 18651
- Joined: Thu 15 Nov 2007, 04:00:00
- Location: Between Canada and Carribean
Re: Most Important Chart of the Century
![]() by Newfie » Wed 31 Mar 2010, 08:11:32
by Newfie » Wed 31 Mar 2010, 08:11:32
While I have not had time to absorb it (must go to work) I found this Wiki article with the following excerpt:
United States public debt
http://en.wikipedia.org/wiki/United_States_public_debt
My bolding
Risks and obstacles
[edit] Risks to the U.S. dollar
A variety of factors are placing increasing pressure on the value of the U.S. dollar, increasing the risk of devaluation or inflation and encouraging challenges to dollar's role as the world's reserve currency. If another currency or basket of currencies replaced the dollar as the reserve currency, the U.S. would face higher interest rates to attract capital, reducing economic growth for the long-term. The Economist wrote in May 2009: "Having spent a fortune bailing out their banks, Western governments will have to pay a price in terms of higher taxes to meet the interest on that debt. In the case of countries (like Britain and America) that have trade as well as budget deficits, those higher taxes will be needed to meet the claims of foreign creditors. Given the political implications of such austerity, the temptation will be to default by stealth, by letting their currencies depreciate. Investors are increasingly alive to this danger..."[40]
Key drivers of these risks relate to the unwillingness of the U.S. to live within its means, both from a budget deficit and trade deficit standpoint. For example, the Government Accountability Office (GAO), the Federal Government's auditor, argues that the U.S. is on a fiscally "unsustainable" path and that politicians and the electorate have been unwilling to change this path.[41] The 2010 U.S. budget indicates annual debt increases of nearly $1 trillion annually through 2019, with an unprecedented $1.0 trillion debt increase in 2009. By 2019 the U.S. national debt will be $18.4 trillion, approximately 148% of 2009 GDP, up from its approximately 80% level in April 2009.[42] Further, the subprime mortgage crisis has significantly increased the financial burden on the U.S. government, with over $10 trillion in commitments or guarantees and $2.6 trillion in investments or expenditures as of May 2009, only some of which are included in the budget document.[43]
The U.S. also has a large trade deficit, meaning imports exceed exports. Financing these deficits requires the USA to borrow large sums from abroad, much of it from countries running trade surpluses, mainly the emerging economies in Asia and oil-exporting nations. The balance of payments identity requires that a country (such as the USA) running a current account deficit also have a capital account (investment) surplus of the same amount. In 2005, Ben Bernanke addressed the implications of the USA's high and rising current account (trade) deficit, resulting from USA imports exceeding its exports. Between 1996 and 2004, the USA current account deficit increased by $650 billion, from 1.5% to 5.8% of GDP.[44]
So, I may have answered my own question. Inflation will cause us to pay back our expensive dollars with cheap ones. However, unless we become trade positive, we will have to continue borrowing in the future, which creates an unsustainable scenario. The sweet spot is where inflation exceeds growth, by just a wee bit, to slowly inflate the balloon. Else it will go "POP" or "fizzzzzzzzzzzzzzzzzzzzzzzzzzzzzzzz."
When going through hell, keep going! Churchill
Nothing is ever lost by courtesy. It is the the cheapest of pleasures, costs nothing, and conveys much. E Wiman
I know there’s no solution, so I just enjoy what’s here and I enjoy the journey G Carlin
Nothing is ever lost by courtesy. It is the the cheapest of pleasures, costs nothing, and conveys much. E Wiman
I know there’s no solution, so I just enjoy what’s here and I enjoy the journey G Carlin
-
Newfie - Forum Moderator
- Posts: 18651
- Joined: Thu 15 Nov 2007, 04:00:00
- Location: Between Canada and Carribean
Re: Most Important Chart of the Century
![]() by maxtechoil » Mon 05 Apr 2010, 10:52:02
by maxtechoil » Mon 05 Apr 2010, 10:52:02
Great posts! Thank you for the information... I will definitely pass this stuff along to my coworkers.
- maxtechoil
- Wood

- Posts: 4
- Joined: Mon 05 Apr 2010, 10:38:12
Re: Most Important Chart of the Century
![]() by Outcast_Searcher » Mon 05 Apr 2010, 15:20:31
by Outcast_Searcher » Mon 05 Apr 2010, 15:20:31
$this->bbcode_second_pass_quote('Newfie', '
')And I don't understand how higher interest (inflation?) causes debt payments to increase - unless you are accruing new debt. For example, if I mortgage a house for $100,000 @10% then if inflation goes up I'm paying the house loan (made with expensive bucks) back with cheap bucks. Assuming my earning power inflates in pace with overall inflation I'm paying back with cheap bucks.
')And I don't understand how higher interest (inflation?) causes debt payments to increase - unless you are accruing new debt. For example, if I mortgage a house for $100,000 @10% then if inflation goes up I'm paying the house loan (made with expensive bucks) back with cheap bucks. Assuming my earning power inflates in pace with overall inflation I'm paying back with cheap bucks.
If the US allows meaningful inflation, short, and especially long term interest rates will soar. The US treasury debt must be rolled over periodically (since we don't pay it off). So, over time, a policy that causes high interest rates on US Treasury debt will cause MASSIVELY high interest payments, further expanding the already large budget deficits. That will scare the markets, which will demand even higher interest rates.
It's all a confidence game, once you're deep in the hole like we are. The risk is an escalating interest rate / debt escalation cycle. If you don't get that stuff under control, you're done. When there is MASSIVE debt and folks are nervous about eventual default via hyperinflation, getting such a spiral under control may become impossible.
THAT's the big risk. Banana republic, anyone?
Like Tyler, I'm not worried about this being in our face -- but if congress doesn't make the hard decisions that give significant reduction in the annual budget deficits BEFORE 2020 real credibility -- this cycle of "debt doom" seems inescapable (IMO).
-

Outcast_Searcher - COB

- Posts: 10142
- Joined: Sat 27 Jun 2009, 21:26:42
- Location: Central KY
Re: Most Important Chart of the Century
![]() by Tyler_JC » Mon 05 Apr 2010, 23:09:20
by Tyler_JC » Mon 05 Apr 2010, 23:09:20
Well said, Outcast.
High inflation makes it easier to pay off old fixed-rate debt (like a traditional home mortgage)
But it becomes extremely difficult to get new loans. When you run a trillion dollar budget deficit, you must continually get new loans. Lots of new loans. And no one will loan you money if you trash your currency.
Merely paying the interest is not enough because a high inflation regime would lead those interest payments to soar over time. You might be treading water but the waves would be getting higher and higher...

We must continually find new buyers for old debt. That's why we can't inflate our way out of the problem. We would have to be extremely careful about it and stop the inflation dead in its tracks before it destroyed the currency. I've seen very few examples of it working, especially in countries that require external financing.
High inflation makes it easier to pay off old fixed-rate debt (like a traditional home mortgage)
But it becomes extremely difficult to get new loans. When you run a trillion dollar budget deficit, you must continually get new loans. Lots of new loans. And no one will loan you money if you trash your currency.
Merely paying the interest is not enough because a high inflation regime would lead those interest payments to soar over time. You might be treading water but the waves would be getting higher and higher...
We must continually find new buyers for old debt. That's why we can't inflate our way out of the problem. We would have to be extremely careful about it and stop the inflation dead in its tracks before it destroyed the currency. I've seen very few examples of it working, especially in countries that require external financing.
"www.peakoil.com is the Myspace of the Apocalypse."
- Tyler_JC
- Expert
- Posts: 5438
- Joined: Sat 25 Sep 2004, 03:00:00
- Location: Boston, MA
Re: Most Important Chart of the Century
![]() by Sixstrings » Tue 06 Apr 2010, 00:00:02
by Sixstrings » Tue 06 Apr 2010, 00:00:02
Ok, my only question about the seriousness of all this is.. when you look at a "top 20" list of the most indebted nations, the US is actually at the bottom (since our debt is mostly in our own currency). Then you have the problem children like Greece and Ireland, with Ireland at #1 with an astounding 1352% external debt to GDP.
And yet.. it is not Mad Max over in Ireland right now.
EDIT: here, I found the CNBC top 20 list, they have the US listed least worst at #20:
http://www.cnbc.com/id/30308959/The_World_s_Biggest_Debtor_Nations?slide=21
And yet.. it is not Mad Max over in Ireland right now.
EDIT: here, I found the CNBC top 20 list, they have the US listed least worst at #20:
http://www.cnbc.com/id/30308959/The_World_s_Biggest_Debtor_Nations?slide=21
-

Sixstrings - Fusion

- Posts: 15160
- Joined: Tue 08 Jul 2008, 03:00:00
Re: Most Important Chart of the Century
![]() by sparky » Tue 06 Apr 2010, 00:17:48
by sparky » Tue 06 Apr 2010, 00:17:48
.
From the page of this firebrand of hard core Marxism " the Financial Times "
this was written by a curmudgeon republican who love Obama not
http://www.ft.com/cms/s/0/f42c2a60-3c1e ... abdc0.html
"America is in on track for Downgrade Day
By Douglas Holtz-Eakin , former director of the Congressional Budget Office
"The Congressional Budget Office has just released its assessment of the administration’s budget outlook.
http://www.cbo.gov/ftpdocs/112xx/doc11231/03-05-apb.pdf
The numbers are shocking. Under the president’s policies the federal deficit will exceed $700bn (€520bn, £467bn) in every year over the next decade. The sea of red ink will more than double the national debt to more than $20,000bn. The upshot is that in 2020, the deficit is projected to be $1,200bn, of which more than $900bn is borrowing to pay interest on previous debt. It is a sorry state of affairs.
But the numbers that are even more important turn out to be the future path of interest payments and revenues. As outlined in its recent report, the credit rating agency Moody’s looks at the fraction of federal revenues dedicated to paying interest as a key metric for retaining a triple-A rating. Specifically, the large, creditworthy sovereign borrowers are expected to devote less than 10 per cent of their revenues to paying interest. Moody’s grants the US extra wiggle-room based on its judgment that the US has a strong ability to repair its condition after a bad shock. The upshot: no downgrade until interest equals 14 per cent of revenues.
Let’s party ‘til 2014 because in the Obama administration budget, D-Day (Downgrade Day) is 2015 when the magic number reaches 14.8 per cent. Moreover, the plan is not merely to flirt with modest deterioration in creditworthiness. In 2020, the ratio reaches 20.1 per cent. The US is on track for a junk-bond bonanza. "
.
-

sparky - Intermediate Crude
- Posts: 3587
- Joined: Mon 09 Apr 2007, 03:00:00
- Location: Sydney , OZ
30 posts
• Page 2 of 2 • 1, 2
Who is online
Users browsing this forum: No registered users and 127 guests