I suppose this is the right place to mention the model I just got published in The Oil Drum, which takes the classic World3 "Limits to growth" model to the world of climate change, peak oil and EROEI. Hope you enjoy it:
http://europe.theoildrum.com/node/5145


PeakOil is You
New World Model based on "Limits to Growth" model
New World Model based on "Limits to Growth" model
![]() by Doly » Sun 12 Apr 2009, 16:11:33
by Doly » Sun 12 Apr 2009, 16:11:33
What are you doing about peak oil?
I am doing this
(click on the www button) v
I am doing this
(click on the www button) v
-

Doly - Expert

- Posts: 4370
- Joined: Fri 03 Dec 2004, 04:00:00
Re: New World Model based on "Limits to Growth" model
![]() by thuja » Sun 12 Apr 2009, 18:39:58
by thuja » Sun 12 Apr 2009, 18:39:58
Thanks for posting this Doly. Very interesting and detailed depiction of what is coming. I think your models don't show decline fast enough for many of the people here. But It seems evident that we are entering an age where basic resources in the form of food and energy will not meet global needs and will lead to a decrease in living standards and average age of mortality.
No Soup for You!!
-

thuja - Intermediate Crude

- Posts: 2202
- Joined: Sat 15 Oct 2005, 03:00:00
- Location: Portland, Oregon
Re: New World Model based on "Limits to Growth" model
![]() by Bas » Sun 12 Apr 2009, 19:27:49
by Bas » Sun 12 Apr 2009, 19:27:49
wow Doly, you must've put some real effort in there, very interesting, especially as I'm reading one of the follow ups on "limits to growth" in which they also use world3.
- Bas
Re: New World Model based on "Limits to Growth" model
![]() by Iaato » Sun 12 Apr 2009, 20:30:14
by Iaato » Sun 12 Apr 2009, 20:30:14
Doly, this is fabulous work. From the graphs, it looks like you used Stella? It's great that you have incorporated EROI and specifying types of energy. I agree with your assumptions about EROI. The inclusion of carbon emissions and resulting graphs fit with my view of what will happen, too.
Your model actually predicts fairly optimistic outcomes, and I have several issues regarding your assumptions. I don't understand why you feel that non-renewable resources such as minerals can be deleted as not important?
What happens if you leave demand out of the model? Is demand essential to include? Doesn't demand follow supply, and won't we essentially use supply as fast as we can? Since there is no way to have more than matching supply and demand, why bother? Might the inclusion of demand create errors by artificially improving supply?
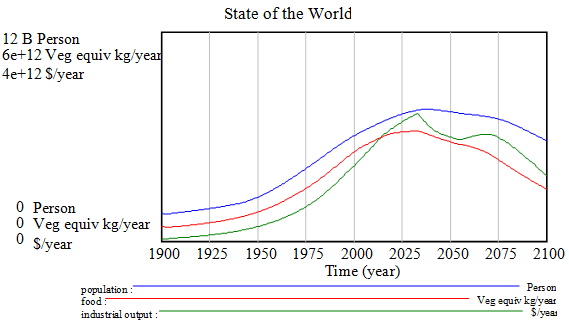
What causes the blip in descent of industrial output, and why is the decline so prolonged? I anticipate a much faster fall. I can understand the initial sharp peak; I view hyperinflation as causing a coming speeding up of world GDP in one big final blast of frenzied activity. But what causes the second lower peak in your model run?
Fabulous work, interesting results.
Your model actually predicts fairly optimistic outcomes, and I have several issues regarding your assumptions. I don't understand why you feel that non-renewable resources such as minerals can be deleted as not important?
What happens if you leave demand out of the model? Is demand essential to include? Doesn't demand follow supply, and won't we essentially use supply as fast as we can? Since there is no way to have more than matching supply and demand, why bother? Might the inclusion of demand create errors by artificially improving supply?
What causes the blip in descent of industrial output, and why is the decline so prolonged? I anticipate a much faster fall. I can understand the initial sharp peak; I view hyperinflation as causing a coming speeding up of world GDP in one big final blast of frenzied activity. But what causes the second lower peak in your model run?
Fabulous work, interesting results.
“Paper money eventually returns to its intrinsic value ---- zero.” --Voltaire
-

Iaato - Heavy Crude

- Posts: 1008
- Joined: Mon 12 Mar 2007, 03:00:00
- Location: As close as I can get to the beginning of the pipe.
Re: New World Model based on "Limits to Growth" model
![]() by shortonsense » Sun 12 Apr 2009, 22:47:32
by shortonsense » Sun 12 Apr 2009, 22:47:32
$this->bbcode_second_pass_quote('Doly', 'I') suppose this is the right place to mention the model I just got published in The Oil Drum, which takes the classic World3 "Limits to growth" model to the world of climate change, peak oil and EROEI. Hope you enjoy it:
http://europe.theoildrum.com/node/5145
http://europe.theoildrum.com/node/5145
May we ask questions without offense being taken? If it is meant as a stand alone, not available for comment article, I will of course respect that position.
-

shortonsense - Permanently Banned
- Posts: 3124
- Joined: Sat 30 Aug 2008, 03:00:00
Re: New World Model based on "Limits to Growth" model
![]() by Quinny » Mon 13 Apr 2009, 04:39:40
by Quinny » Mon 13 Apr 2009, 04:39:40
Excellent - thankyou
Live, Love, Learn, Leave Legacy.....oh and have a Laugh while you're doing it!
-

Quinny - Intermediate Crude
- Posts: 3337
- Joined: Thu 03 Jul 2008, 03:00:00
Re: New World Model based on "Limits to Growth" model
![]() by Doly » Sun 26 Apr 2009, 16:39:00
by Doly » Sun 26 Apr 2009, 16:39:00
Of course you may ask questions! That was the point of posting here. I'm not a regular poster as I used to be (not working in a callcentre any more with plenty of five-minute gaps to fill in the day), but I still believe in discussion forums. Sorry for not replying before, I've been crazy busy lately.
$this->bbcode_second_pass_quote('Iaato', 'F')rom the graphs, it looks like you used Stella?
$this->bbcode_second_pass_quote('Iaato', 'F')rom the graphs, it looks like you used Stella?
No, it's Vensim. You can download it from free here:
http://www.vensim.com/freedownload.html
$this->bbcode_second_pass_quote('', 'I') don't understand why you feel that non-renewable resources such as minerals can be deleted as not important?
The purely logical reason is that with unlimited energy, you could get minerals from anywhere, asteroids or nuclear reactions. The main limiting factor is energy, rather than materials.
There is another, more practical reason, which is I can't think of a way of amalgamating all minerals together that could make sense. And, like Ugo Bardi likes to show in his presentations, estimating the amount of available minerals is a trickier issue than for fossil fuels (look up "mineralogical barrier")
$this->bbcode_second_pass_quote('', 'W')hat happens if you leave demand out of the model? Is demand essential to include?
Yes, it's essential, because with no demand, there is no exploitation. You don't consume something that isn't demanded.
$this->bbcode_second_pass_quote('', 'D')oesn't demand follow supply, and won't we essentially use supply as fast as we can?
An economist would have a seizure reading that. ("Of course it's the other way round! Supply follows demand!") Me, not being an economist, can see your point of view. But it's actually incorrect for the past. In the past, fossil fuels weren't exploited as fast as they possibly could, they were exploited according to demand, that, true, was growing steadily, but not as fast as technology could have possibly exploited the fields.
$this->bbcode_second_pass_quote('', 'S')ince there is no way to have more than matching supply and demand, why bother?
Because I'm trying to figure out what happens with a whole lot of energy sources, that's why. If I only had to deal with one, I wouldn't have bothered. But if I'm trying to find out how people will change from one energy source to another, I don't see how it can be done without thinking about demand.
$this->bbcode_second_pass_quote('', 'M')ight the inclusion of demand create errors by artificially improving supply?
Look at my number of posts. Do you think that somebody that managed to be so obsessive about peakoil.com at one point could possibly make that mistake? No, of course not. Supply will match demand only when it's physically possible. When not, supply will be only as great as geological constraints permit.
$this->bbcode_second_pass_quote('', 'W')hat causes the blip in descent of industrial output, and why is the decline so prolonged?