

http://www.theoildrum.com/files/Picture%2031.png
Finally I did it by manually measuring the points with a ruler.
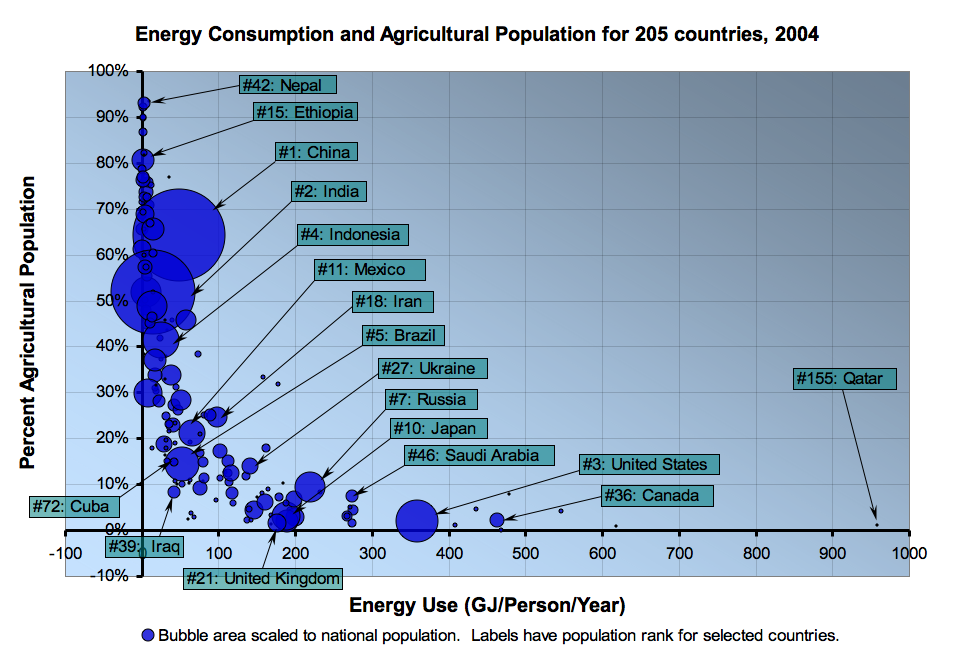
I've managed to obtain a set of points and produce a formula
to calculate the proportion of the population engage in Agriculture
But I would like someone else to have a go at producing a better formula than mine because I'm not very good at curve fitting.
$this->bbcode_second_pass_code('', '
data is given in {x,y}
where x is the Energy Use (GJ/Person/Year)
and y is the proportion of population.
data = {{2.5, 0.922},
{9.8, 0.742},
{14.8, 0.587},
{22.2, 0.448},
{24.7, 0.334},
{34.6, 0.265},
{44.5, 0.2},
{69.3, 0.147},
{108.9, 0.106},
{158.4, 0.073},
{247.5, 0.049},
{356.4, 0.024},
{574.2, 0.02}
}
My formula for curve fitting is
f[x] = 1/1.04333^x + 0.0403 if x < 45.70874862756447
f[x] = (1/x)^0.269384 - 0.172958 if x >= 45.70874862756447
')
