Peak Minerals
http://europe.theoildrum.com/node/3086
$this->bbcode_second_pass_quote('', '[')b]Abstract: We examined the world production of 57 minerals reported in the database of the United States Geological Survey (USGS). Of these, we found 11 cases where production has clearly peaked and is now declining. Several more may be peaking or be close to peaking. Fitting the production curve with a logistic function we see that, in most cases, the ultimate amount extrapolated from the fitting corresponds well to the amount obtained summing the cumulative production so far and the reserves estimated by the USGS. These results are a clear indication that the Hubbert model is valid for the worldwide production of minerals and not just for regional cases. It strongly supports the concept that “Peak oil” is just one of several cases of worldwide peaking and decline of a depletable resource. Many more mineral resources may peak worldwide and start their decline in the near future.


PeakOil is You
Peak Minerals
18 posts
• Page 1 of 1
"Everything is proceeding as I have foreseen." The Emperor (Return of the Jedi)
The Oil Drum: Europe
The Oil Drum: Europe
-

clv101 - Heavy Crude

- Posts: 1050
- Joined: Wed 02 Jun 2004, 03:00:00
- Location: Bristol, UK
Re: Peak Minerals
![]() by IslandCrow » Mon 15 Oct 2007, 09:25:48
by IslandCrow » Mon 15 Oct 2007, 09:25:48
The first two metals in the report could have shown a peak because of above ground factors. Both mercury and lead have been deemed "NOT GOOD FOR ONE'S HEALTH".
An interesting attempt to broaden the appeal of the concept "Peak", but more work will need to be done on the reasons for the decline.
An interesting attempt to broaden the appeal of the concept "Peak", but more work will need to be done on the reasons for the decline.
We should teach our children the 4-Rs: Reduce, Reuse, Recycle and Rejoice.
-

IslandCrow - Heavy Crude
- Posts: 1272
- Joined: Mon 12 Sep 2005, 03:00:00
- Location: Finland
Re: Peak Minerals
![]() by Tyler_JC » Mon 15 Oct 2007, 11:36:36
by Tyler_JC » Mon 15 Oct 2007, 11:36:36
More evidence that Peak has little to do with geology and everything to do with economics and politics.
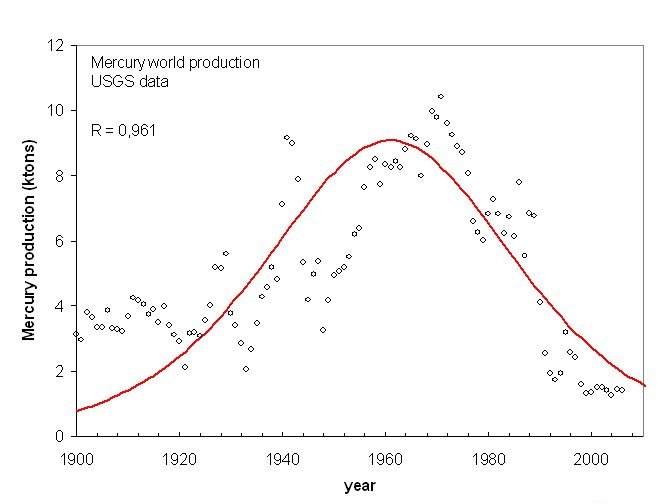
I don't see a bell curve, I see a collection of world events that have lead to dramatic changes in mercury demand over the course of the 20th century.
1. Demand was fairly constant in the early part of the century but exploded in the post WWI economic boom.
2. Economic depression in the 1930s lead to a dramatic contraction in mercury demand and thus a decline in production.
3. War time demand for mercury in WWII caused production to expand again.
4. By the 1970s, the ill health effects of mercury combined with an increase in the availability of affordable substitutes lead to a decline in demand, lowering production.
And none of these things are related to Dr. Hubbert's theory.

Does that chart look anything like the production profile for the combined total of global mercury mines?
I don't see a bell curve, I see a collection of world events that have lead to dramatic changes in mercury demand over the course of the 20th century.
1. Demand was fairly constant in the early part of the century but exploded in the post WWI economic boom.
2. Economic depression in the 1930s lead to a dramatic contraction in mercury demand and thus a decline in production.
3. War time demand for mercury in WWII caused production to expand again.
4. By the 1970s, the ill health effects of mercury combined with an increase in the availability of affordable substitutes lead to a decline in demand, lowering production.
And none of these things are related to Dr. Hubbert's theory.
Does that chart look anything like the production profile for the combined total of global mercury mines?
"www.peakoil.com is the Myspace of the Apocalypse."
- Tyler_JC
- Expert

- Posts: 5438
- Joined: Sat 25 Sep 2004, 03:00:00
- Location: Boston, MA
Re: Peak Minerals
![]() by bardi » Mon 15 Oct 2007, 13:36:14
by bardi » Mon 15 Oct 2007, 13:36:14
Tyler, the figure that you are showing is an old attempt at understanding the reasons for the peak. For some time, it was believed that the peak was caused by some specific characteristic of the yeld curve of single oil wells. But that interpretation is obsolete.
Peak oil (as any "peak resource") is due to a combination of economical and geological factors. The theory behind the peak is explained in the references given in the paper (Naill, Bardi, Reynolds and Holland). "Above the ground" factors are just as important as "below the ground" ones and the bell curve and the peak occurs for all kinds of resources, independently of the yeld curve of individual sites.
Then, each resource has its individual history and specific characteristics. At the beginning we, too, thought that mercury was a case of peak forced by legislation. But in the end we saw the good agreement of the curve with the geological estimates of the reserves. We believe now that people have extracted as much mercury as they could, given the prevalent economic conditions.
UB
-

bardi - Wood

- Posts: 2
- Joined: Mon 15 Oct 2007, 03:00:00
Re: Peak Minerals
![]() by threadbear » Mon 15 Oct 2007, 14:10:32
by threadbear » Mon 15 Oct 2007, 14:10:32
$this->bbcode_second_pass_quote('bardi', 'T')yler, the figure that you are showing is an old attempt at understanding the reasons for the peak. For some time, it was believed that the peak was caused by some specific characteristic of the yeld curve of single oil wells. But that interpretation is obsolete.
Peak oil (as any "peak resource") is due to a combination of economical and geological factors. The theory behind the peak is explained in the references given in the paper (Naill, Bardi, Reynolds and Holland). "Above the ground" factors are just as important as "below the ground" ones and the bell curve and the peak occurs for all kinds of resources, independently of the yeld curve of individual sites.
Then, each resource has its individual history and specific characteristics. At the beginning we, too, thought that mercury was a case of peak forced by legislation. But in the end we saw the good agreement of the curve with the geological estimates of the reserves. We believe now that people have extracted as much mercury as they could, given the prevalent economic conditions.
UB
Exactly what does, "given the prevalent economic conditions" mean? This sounds like a drop in demand, reflected in lower prices, doesn't encourage mining. This has little to do with actual availability under ground.
-
threadbear - Expert
- Posts: 7577
- Joined: Sat 22 Jan 2005, 04:00:00
Re: Peak Minerals
![]() by JPL » Mon 15 Oct 2007, 17:34:18
by JPL » Mon 15 Oct 2007, 17:34:18
Try it again for copper. From what I remember from my old geology notes, that's the next domino to go down after oil.
Not so much left of it as there used to be (oops)...
JP
Not so much left of it as there used to be (oops)...
JP
- JPL
- Heavy Crude
- Posts: 1264
- Joined: Sat 18 Mar 2006, 04:00:00
- Location: Off with the Fey Folk
Re: Peak Minerals
![]() by bardi » Mon 15 Oct 2007, 17:44:47
by bardi » Mon 15 Oct 2007, 17:44:47
$this->bbcode_second_pass_quote('', '
')
Exactly what does, "given the prevalent economic conditions" mean? This sounds like a drop in demand, reflected in lower prices, doesn't encourage mining. This has little to do with actual availability under ground.
')
Exactly what does, "given the prevalent economic conditions" mean? This sounds like a drop in demand, reflected in lower prices, doesn't encourage mining. This has little to do with actual availability under ground.
This is exactly the point! The Hubbert theory is not just about what is available under ground. It is about how the progressively increasing cost of extraction combines with the market system.
So, we are not saying that the metals we considered peaked ONLY because of supply constraints, but that they peaked because of a combination of demand and supply constraints.
-
bardi - Wood
- Posts: 2
- Joined: Mon 15 Oct 2007, 03:00:00
Re: Peak Minerals
![]() by MacG » Mon 15 Oct 2007, 17:50:57
by MacG » Mon 15 Oct 2007, 17:50:57
$this->bbcode_second_pass_quote('JPL', 'T')ry it again for copper. From what I remember from my old geology notes, that's the next domino to go down after oil.
Not so much left of it as there used to be (oops)...
JP
Not so much left of it as there used to be (oops)...
JP
Without fossil energy, copper is gone. All the copper we will have is the one we have above ground in refined state. They mine copper ores down to 0.2% these days (20 kilo per ton stone). Without fossil energy, this would not happen. The copper is gone folks. As is the gold and silver. Did I mention zinc and nickel? Gone to. Over with.
-

MacG - Heavy Crude
- Posts: 1137
- Joined: Sat 04 Jun 2005, 03:00:00