$this->bbcode_second_pass_quote('jimk', '')$this->bbcode_second_pass_quote('WebHubbleTelescope', '
')look familiar?


PeakOil is You
Logistic equation model for collapse, or?
Re: Logistic equation model for collapse, or?
![]() by WebHubbleTelescope » Tue 05 Jun 2007, 02:02:41
by WebHubbleTelescope » Tue 05 Jun 2007, 02:02:41
Thanks for the link!
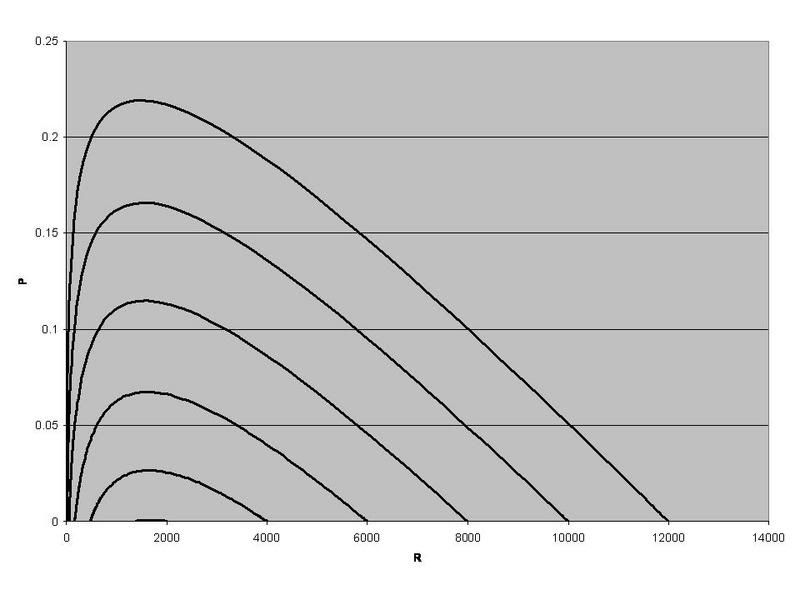
The graph is surely almost identical to what I posted. But there is one odd thing. The prey peak looks just like my P peak... but P would seem to correspond more to the predator in my equations. Maybe it just has to do with the parameter values.
Anyway, fun stuff to explore.
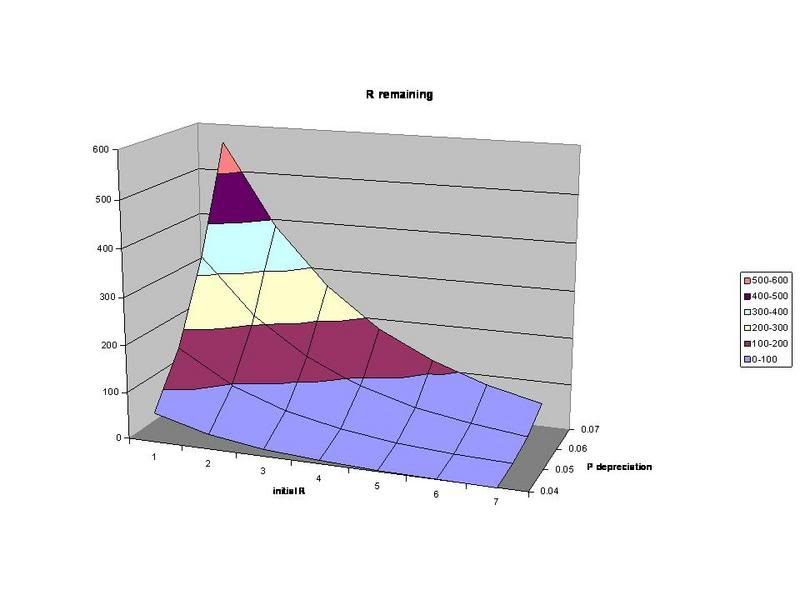
I don't find it odd that R is actually the prey term. You have to remember that R is oil in reserve. Forget the "c" term you added. R will decrease to zero and the thing that looks like the production curve is P*R, which is the absolute rate of change in R according to your equation. Which means the PR curve you showed earlier is the correct one to use as the production curve.
-

WebHubbleTelescope - Tar Sands

- Posts: 950
- Joined: Thu 08 Jul 2004, 03:00:00
Re: Logistic equation model for collapse, or?
![]() by jimk » Tue 05 Jun 2007, 15:16:10
by jimk » Tue 05 Jun 2007, 15:16:10
$this->bbcode_second_pass_quote('WebHubbleTelescope', '
')I don't find it odd that R is actually the prey term. You have to remember that R is oil in reserve. Forget the "c" term you added. R will decrease to zero and the thing that looks like the production curve is P*R, which is the absolute rate of change in R according to your equation. Which means the PR curve you showed earlier is the correct one to use as the production curve.
')I don't find it odd that R is actually the prey term. You have to remember that R is oil in reserve. Forget the "c" term you added. R will decrease to zero and the thing that looks like the production curve is P*R, which is the absolute rate of change in R according to your equation. Which means the PR curve you showed earlier is the correct one to use as the production curve.
Yes, of course R=oil should be the prey, my "c" term is just a distraction, and PR is production.
What throws me off a bit is looking at the baboons and the cheetahs. My R curve doesn't really look like that baboon curve! But the equations really are different.
Anyway, thanks much for seeing the link to predator-prey, that is really interesting to think about. I will take some time to study your discovery / shock model next.
-

jimk - Peat

- Posts: 90
- Joined: Sun 12 Feb 2006, 04:00:00
- Location: New York State, USA
Re: Logistic equation model for collapse, or?
![]() by WebHubbleTelescope » Tue 05 Jun 2007, 23:19:09
by WebHubbleTelescope » Tue 05 Jun 2007, 23:19:09
$this->bbcode_second_pass_quote('jimk', '
')Anyway, thanks much for seeing the link to predator-prey, that is really interesting to think about. I will take some time to study your discovery / shock model next.
')Anyway, thanks much for seeing the link to predator-prey, that is really interesting to think about. I will take some time to study your discovery / shock model next.
The discovery model is straightforward to derive. The basic premise is to imagine a stochastic probe of varying volume that sweeps through a volume of material that contains a small fraction of sporadically positioned oil. The discovery peak comes about due to two factors: the upswing comes about as the probe volume monotonically increases each year as exploration improves, while the downswing occurs as the probe starts hitting the limits of oil-containing regions. The long decline occurs as we continue to hit unexplored regions with a finite probability; this part effectively models reserve growth.
The shock model describes the dynamics of oil depletion and can use either the discovery model or discovery data as input. The main premise here is to assume Markovian rate laws to describe the latencies as oil flows out of the ground.
I can say that this combined model is so far removed from the typical Logistic approach as to require a different mindset. I agree with you about trying to come up with different ideas as the current approaches add about zero insight and generate no intuition as to the way things might proceed into the future.
-
WebHubbleTelescope - Tar Sands
- Posts: 950
- Joined: Thu 08 Jul 2004, 03:00:00