Sorry, the equations are a bit abstract!
R is indeed the amount of resource in the ground. dR/dt is mostly negative: dR/dt = -PR. In the open system I add in a positive constant, so dR/dt = c-PR. Over the millions of years when we are not burning fossil fuel, sunlight gets turned into stored fuel which slowly builds up. Then our rate of burning quickly burns through what has built up. So in the open system dR/dt oscillates between positive and negative.
P is the fractional rate of resource extraction, i.e. like what percentage of the resource gets extracted in unit time.
Somehow this fractional rate of extraction changes over time. So that's what I am trying to look at and change a bit from the logistic equation. The fractional rate has to do with whatever facilities we build up to enable extraction. These grow through investment and decay through depreciation. The facilities are some mix of human beings and machinery and whatever else.
Of course one can easily build up a more complicated model with many more dynamic variables and parameters. The advantage of a simpler model is not just that the simulations run faster. It can actually improve predictive power. If the number of parameters exceeds the number of data points, then one can fit the data exactly with a variety of different parameter value combinations, each predicting a different future. If one can find a pretty good fit to many data points with very few parameter values, then the prediction of the future evolution is not so arbitrary.
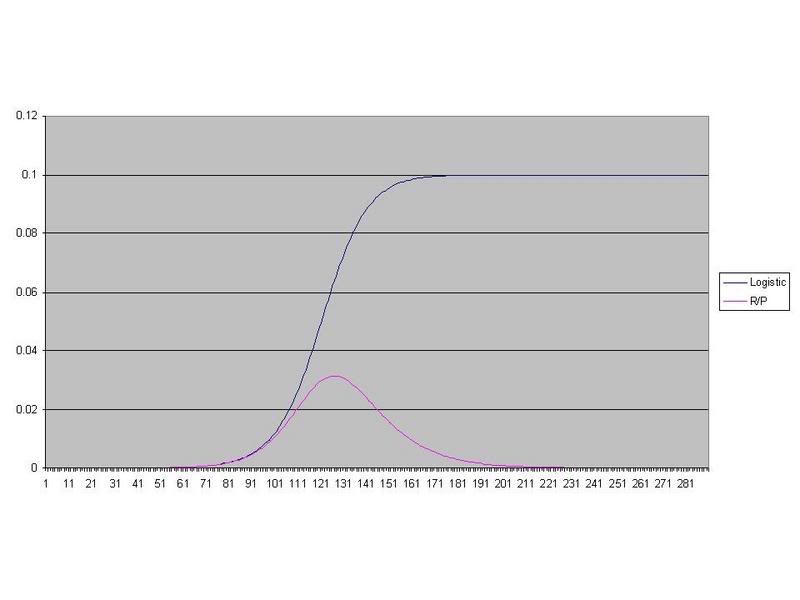
Whether the R/P system I have proposed here will give a better fit, I don't know. I am not claiming that it will! I am just offering these equations as a way of exploring the family of equations that are quite similar to the logistic equation. Sketching out a range of plausible models is one step, then narrowing down to the best fit is another step. My proposal is just one contribution to that first step.
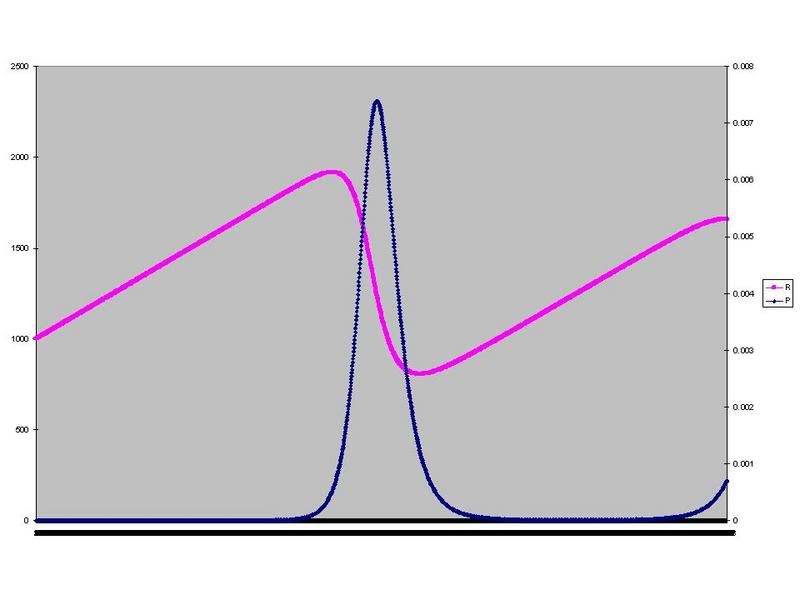
Here is another plot of a simulation run, giving R and P. The horizontal time axis should run from 0 to about 2200 - I don't know how to fix up the excel axis labelling, sorry.
This is the open R/P system, with parameter values c=1; a=0.00004
; b=0.05; the initial values are R=1000; P=1E-07.