It is odd, looking back in history, how there often seems to be a furious attempt to maintain an outmoded technology in its waning phase. For instance, at the dawn of the railway age, river canals continued to attract investment and government support. Some of the most graceful and efficient sail shiips were launched after the steam ship age.
But, this is so much dumber, because these superhighways will cost the use of productive land forever and saddle taxpayers with ongoing maintenance bills. I am convinced that the root force behind all this is political connections and cash flow to friendly contractors.
I don't think any politician has ever seen highway plans he didn't like, unless it went through a part of a city or town that affected high class housing values. As for the rest of us, we are mere peons, as Robert Moses proved with his expressway disasters around NYC that chopped up functional working class neighbourhoods fifty years ago.


PeakOil is You
THE Road & Highway Thread (merged)
Re: Super Highway Stupidity
![]() by Denny » Thu 31 Aug 2006, 22:13:08
by Denny » Thu 31 Aug 2006, 22:13:08
-

Denny - Heavy Crude

- Posts: 1738
- Joined: Sat 10 Jul 2004, 03:00:00
- Location: Canada
Future of Highways
![]() by gwmss15 » Fri 05 Jan 2007, 10:47:10
by gwmss15 » Fri 05 Jan 2007, 10:47:10
Is this the future of highways in the USA
This image is of an international highway in eastern thailand it is the gate way to the industral eastern areas of thailand they have a good bus service on this road but it is very slow and not very comfortable it take about 14 hours of bouncing up and down on a non aircond bus to travel this road total length is around 150 miles. I know because i used the bus on this road.
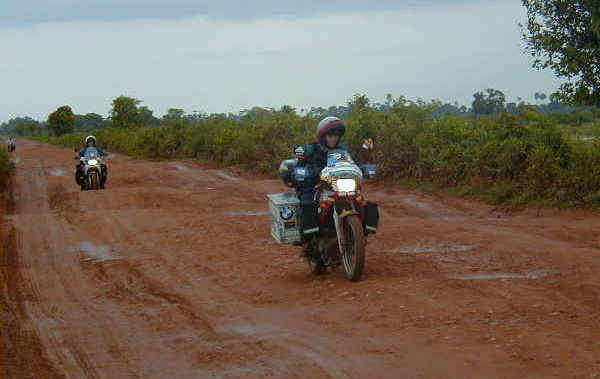
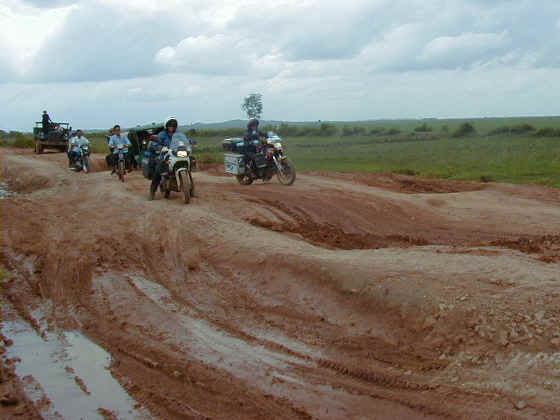
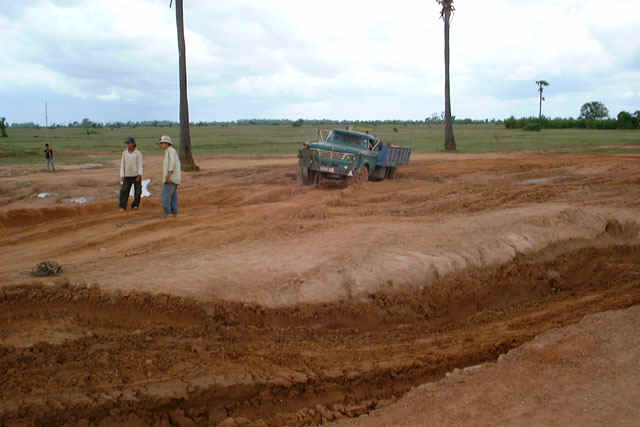
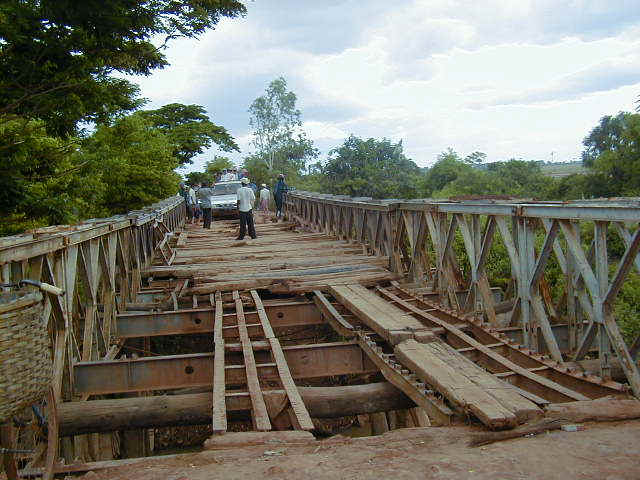

Remember this is highway 1 an international trade route. Is this the future of highway travel?
This image is of an international highway in eastern thailand it is the gate way to the industral eastern areas of thailand they have a good bus service on this road but it is very slow and not very comfortable it take about 14 hours of bouncing up and down on a non aircond bus to travel this road total length is around 150 miles. I know because i used the bus on this road.
Remember this is highway 1 an international trade route. Is this the future of highway travel?
-
gwmss15 - Peat

- Posts: 199
- Joined: Wed 13 Oct 2004, 03:00:00
- Location: Mahachai City
Re: Future of Highways
![]() by PolestaR » Fri 05 Jan 2007, 11:20:40
by PolestaR » Fri 05 Jan 2007, 11:20:40
It's pretty much the future.. except you have cars/motorbikes/trucks in the photos there.
Bringing sexy back..... to doom
- PolestaR
- Tar Sands

- Posts: 955
- Joined: Tue 21 Jun 2005, 03:00:00
Re: Future of Highways
![]() by mgibbons19 » Fri 05 Jan 2007, 11:47:12
by mgibbons19 » Fri 05 Jan 2007, 11:47:12
would make for some entertaining 4-wheeling. but would suck for real travel.
It is an interesting question though, and one that I think we can only postulate answers to based on various assumptions going forward.
Purely solar? Think of the wagon trains and the wheel ruts of the plains.
wierd mix of state collapse and some fuel availability? - might look like that.
light energy, reasonable state secuity? maybe reusing and minimally maintaining highway infrastructure for efficient vehicle use, bikes, motorbikes, buses, whatever
cornucopian vision, state stays stable, energy is from something new, the hyper car succeeds, then we'll be zooming along in lightweight carbon fiber vehicles in constant communication with each other and the roadways to minimize safety concerns.
- mgibbons19
- Heavy Crude
- Posts: 1105
- Joined: Fri 20 Aug 2004, 03:00:00
Re: Future of Highways
![]() by Andrew_S » Fri 05 Jan 2007, 12:43:50
by Andrew_S » Fri 05 Jan 2007, 12:43:50
Couldn't they afford to build a decent road? If this is a busy highway it would be worth the investment ... except for PO to come.
- Andrew_S
- Tar Sands
- Posts: 634
- Joined: Sun 09 Jan 2005, 04:00:00
Re: Future of Highways
![]() by peaker_2005 » Fri 05 Jan 2007, 14:20:56
by peaker_2005 » Fri 05 Jan 2007, 14:20:56
$this->bbcode_second_pass_quote('Andrew_S', 'C')ouldn't they afford to build a decent road? If this is a busy highway it would be worth the investment ... except for PO to come.
Even with PO, roads will remain important. There are areas that methods of transport such as trains simply cannot reach (due to steep grades etc.).
For example, the Snowy Mountains would be inaccessible by railway (the steep grades required would prevent it). You could get as far as Cooma or perhaps Jindabyne but no further.
In Thailand, I believe railways aren't so prevalent (at least they didn't seem so on the maps I've seen), so I suspect it would be the kind of place where maintaining the roads would be of major importance.
Parts of Australia don't do much better, and this is a First-world country.
I know that terminology is old-school, but everyone knows it, which is why I've used it).
"Human beings, who are almost unique in having the ability to learn from the experience of others, are also remarkable for their apparent disinclination to do so." - Douglas Adams
-

peaker_2005 - Tar Sands
- Posts: 686
- Joined: Fri 02 Sep 2005, 03:00:00
Re: Future of Highways
![]() by Kfish » Fri 05 Jan 2007, 21:22:12
by Kfish » Fri 05 Jan 2007, 21:22:12
I've just got back from England, and one of the most interesting places I saw was King's Lynn (lynn - old English for harbour). It's a medieval harbour city - but it's nowhere near the Channel, or any other country.
Before about the 1800s, moving things around England via the coast was actually much easier than lumping them across land. Alternatively, things moved by barge up rivers and canals.
Obviously England is well set up for this, having a high coastline / area ratio, but it's also possible that if roads degenerate to the point shown in those photos, water-based transport may become more popular than it is now.
The idea of shipping as a purely international mode of transport is quite new. It's entirely possible that if such
Build your soil
Build your skills
Build your community
Build your skills
Build your community
-
Kfish - Peat
- Posts: 89
- Joined: Fri 31 Mar 2006, 04:00:00
Re: Future of Highways
![]() by TigPil » Fri 05 Jan 2007, 21:38:39
by TigPil » Fri 05 Jan 2007, 21:38:39
Before railroads the cost of land transport was about 50 times greater than the cost of sea transport and 10 times greater than the cost of river transport. It's one of the reasons that there are so many coastal cities the world over. Historically the economic benefits of having access to the sea or at least to a river were very significant.
Whether highways end up like those pictures will depend on the availability of alternate energy post-peak and whether there will be enough to maintain a substantial number of personal vehicles as well as maintain a highway infrastructure appropriate to those vehicles.
Whether highways end up like those pictures will depend on the availability of alternate energy post-peak and whether there will be enough to maintain a substantial number of personal vehicles as well as maintain a highway infrastructure appropriate to those vehicles.
-
TigPil - Wood
- Posts: 42
- Joined: Tue 02 Jan 2007, 04:00:00
Re: Future of Highways
![]() by Denny » Fri 05 Jan 2007, 21:57:31
by Denny » Fri 05 Jan 2007, 21:57:31
Evemn is they can't afford a great road with asphalt, or even gravel, couldn't the county at least send the grader out now and again?
-
Denny - Heavy Crude
- Posts: 1738
- Joined: Sat 10 Jul 2004, 03:00:00
- Location: Canada


Re: Future of Highways
![]() by pea-jay » Sat 06 Jan 2007, 06:49:26
by pea-jay » Sat 06 Jan 2007, 06:49:26
Absent significant trucking volumes and reduced freeze-thaw cycles (pavement's biggest villain) due to Global Warming, I'd say many of our roads will be with us for quite along time. I'm not an engineer but I used to deal with the roads department quite abit where I used to work.
The key (as far as I was able to gather) to road survival is in the road base. What and how you choose to build your road structures with will dictate their plausible lifespans before factoring in traffic and climate. Build a road with an extensive base and internal rebar and use high grade aggregate concrete, dont subject it to much traffic or winter and I would expect it to outlast most of our lifespans. We wouldnt even be talking much in the way of maintenance really.
Look at the Romans--their stuff stood and were used for centuries, even millenia with minimal effort. Modern Europe is littered with ancient, medieval bridge crossings still in use.
Having said that, our cheap-ass suburban streets and remote county roads are toast.
UNplanning the future...
http://unplanning.blogspot.com
http://unplanning.blogspot.com
-

pea-jay - Heavy Crude
- Posts: 1547
- Joined: Sat 17 Jul 2004, 03:00:00
- Location: NorCal
what's more oil intensive: a mile of highway or train tracks
![]() by wtshtf_in_ks » Sun 28 Oct 2007, 21:32:03
by wtshtf_in_ks » Sun 28 Oct 2007, 21:32:03
i live in a rural town unserved by amtrak, greyhound or other mass transit. to get out of here w/out an auto you can bike (if you're fit) or hop a bnsf grainer at the rail yard to wichita (if you're adventurous). in a less severe situation i assume most people here would rather motorbike (after buying them from less fortunate people in the 3rd world who have to go off the grid?)than use an express bus or install electrified commuter rail at 300+/barrel. but what would be cheaper to build and maintain: tracks or asphalt? i know the price of asphalt has gone way up because its oil based but what about train tracks?
-
wtshtf_in_ks - Wood
- Posts: 7
- Joined: Sun 28 Oct 2007, 03:00:00
Re: what's more oil intensive: a mile of highway or train tr
![]() by like_the_dinosaurs » Sun 28 Oct 2007, 22:30:32
by like_the_dinosaurs » Sun 28 Oct 2007, 22:30:32
I'd be willing to bet that a train track is far cheaper to maintain and build.
-

like_the_dinosaurs - Peat
- Posts: 164
- Joined: Sat 23 Jun 2007, 03:00:00
- Location: Australia
Re: what's more oil intensive: a mile of highway or train tr
![]() by cynthia » Sun 28 Oct 2007, 22:38:32
by cynthia » Sun 28 Oct 2007, 22:38:32
I can't speak to the cost of steel for repairs and upgrades. I know we sold quite a bit overseas and that has driven our domestic prices higher but here's an article about a small town rail that shippers wanted to keep going:
http://www.gazettetimes.com/articles/20 ... bailey.txt
It seems to me that rail pencils out on the plus side of doing business.
cynthia
http://www.gazettetimes.com/articles/20 ... bailey.txt
It seems to me that rail pencils out on the plus side of doing business.
cynthia
-
cynthia - Coal
- Posts: 412
- Joined: Sun 29 May 2005, 03:00:00
Re: what's more oil intensive: a mile of highway or train tr
![]() by Peepers » Sun 28 Oct 2007, 23:24:34
by Peepers » Sun 28 Oct 2007, 23:24:34
Interesting question. My experience is that construction of a road and railroad right of way from the bottom of the subgrade to the ballast is the same. Where there is a layer of ballast (the crushed stone), crossties (sleepers, for you folks in Europe), tie plates, spikes or clips and rails on a railroad track, there is at least two layers of asphalt or steel rebar-reinforced concrete for roads.
I think the biggest difference, however, is the width of the two rights of way. A two-track railroad can handle 80-100 freight trains per day, or mixed traffic of 40-70 daily freight trains plus 5-20 daily passenger trains, or a passenger-only right of way 100-150 daily trains. 100 freight trains, ranging from 75-150 cars long, equates to 22,500 to 45,000 trucks per day. On the passenger-only railway, those 150 daily passenger trains carrying 100-1,000 people per train equates to 18,000 to 180,000 cars per day. Figure something in the middle of the passenger and freight capacities for the mixed-trafffic railway.
When it comes to comparable highway capacity, we're talking a 4- to 8-lane superhighway that can be at least several times wider than a railroad line of equivalent capacity.
So I guess you'd have figure out what freight/passenger capacity needs to be accommodated, then identify how much construction material is needed to build out the proper widths of the right of way alternatives.
Sorry I couldn't be more specific.
-
Peepers - Lignite
- Posts: 221
- Joined: Sat 01 Jan 2005, 04:00:00
Re: what's more oil intensive: a mile of highway or train tr
![]() by Kingcoal » Mon 29 Oct 2007, 01:00:42
by Kingcoal » Mon 29 Oct 2007, 01:00:42
We've hashed this out before and I believe the figure is that a highway is about 10 times the combined cost of construction and maintanance of an similar sized railroad.
"That's the problem with mercy, kid... It just ain't professional" - Fast Eddie, The Color of Money
-

Kingcoal - Expert

- Posts: 2149
- Joined: Wed 29 Sep 2004, 03:00:00
- Location: Pennsylvania, USA
Re: what's more oil intensive: a mile of highway or train tr
![]() by Petrodollar » Mon 29 Oct 2007, 10:12:20
by Petrodollar » Mon 29 Oct 2007, 10:12:20
...this is a somewhat complex question, and I'm not an expert on this topic, but here's my general understanding:
1) I suspect the monetary cost and energy costs in building one mile of roadway is probably similar to the costs of building one mile of railway. (this applies to initial construction costs only - irrespective of the various tax issues and operations, etc).
2) The operations phase/maintenance for rail and light rail systems is significantly lower than roadways/highways - especially in cold climates where freezing water and heavy transit damage asphalt surfaces with regularity (i.e., "potholes" and other degradation of the surface, etc). A lot of time, money and petroleum-based energy is expended in maintaining a high-quality asphalt surface that experiences heavy traffic volume.
3) The energy efficiency of moving x tons via rail versus x tons via trucking is significantly in favor of rail-based systems (btw, water ways are traditionally the most efficient means to move freight...but I digress)
4) The energy efficiency of moving x persons via electric rail/light rail systems versus x persons via petroleum-based transportation alternatives (e.g., cars, buses, etc) is somewhat in favor of most rail-based systems.
An excellent source of info is: www.lightrailnow.org.
Here's some detailed info from that site:
$this->bbcode_second_pass_quote('', '[')b]Transport Energy Debate:
How Many BTUs on the Head of a Pin? ...er...Power Line?
Light Rail Now Project Team • August 2007
(excerpt)
The table and graph below provide a comparison on the basis of fully assessed energy consumption, including production, distribution, and end-use, for each mode. Clearly, these major public transit modes provide substantially improved energy efficiency than private motor vehicles – as gauged by energy intensity (lower = better) – with definite potential for significantly reducing US dependency on petroleum.
Urban Transportation Energy Intensity – Major Modes
(BTUs per Passenger-Mile)
Transport Mode BTU/p-m
Urban car 5,760
Motor bus 5,410
LRT 3,473
RRT 2,703
RPR 2,743
Trolleybus 4,004
LRT Light rail transit
RRT Rail rapid transit
RPR Regional passenger rail ("commuter rail")
Urban Transportation Energy Intensity – Major Modes
(BTUs per Passenger-Mile)

...the differences re CO2 emissions are also quite signifcant b/t the two systems...
$this->bbcode_second_pass_quote('', ' ')But what about carbon emissions? Whereas 100% of the energy used by all petroleum and gas-powered transportation modes emits CO2, only about 70% of US electric power is derived from CO2-emitting sources.
The table and graph below – again, on the basis of fully assessed energy, including production, distribution, and end-use, for each mode – compare energy intensity with respect to carbon-emitting energy sources. Obviously, electric rail transit and electric trolleybus modes provide substantially better carbon-based energy efficiency than motor vehicles, either motor bus or private car, and thus represent a very promising tool in the effort to reduce carbon emissions and thus to mitigate Global Warming.
Urban Transportation Carbon-Emitting Energy Intensity – Major Modes
(BTUs per Passenger-Mile)
Transport Mode BTU/p-m
Urban car 5,760
Motor bus 5,410
LRT 2,431
RRT 1,892
RPR 2,257
Trolleybus 2,803
LRT Light rail transit
RRT Rail rapid transit
RPR Regional passenger rail ("commuter rail")
Urban Transportation Carbon-Emitting Energy Intensity – Major Modes
(BTUs per Passenger-Mile)

....of course this is an ongoing debate...
-

Petrodollar - Coal
- Posts: 406
- Joined: Tue 19 Jul 2005, 03:00:00
- Location: Maryland
Re: what's more oil intensive: a mile of highway or train tr
![]() by alokin » Mon 29 Oct 2007, 22:25:09
by alokin » Mon 29 Oct 2007, 22:25:09
I'm an expert but asphalt is a petroleum by-product. Whereas railway sleepers are concrete or timber.
A railway can transport significantly more people and products. And it connects much more because not everyone can drive or has a car, but the railway can be used by everyone.
A railway can rely on different types of energy (steam oil electric).
The crucial thing is the service: if it runs twice a day, nobody will use it, if it runs every hour, many people will use it if it runs every half an hour, nobody prefers the car (unless the tickets are too expensive).
There are pretty much private railways nowadays.
-
alokin - Heavy Crude
- Posts: 1255
- Joined: Fri 24 Aug 2007, 03:00:00
Re: what's more oil intensive: a mile of highway or train tr
![]() by Blacksmith » Tue 30 Oct 2007, 03:35:08
by Blacksmith » Tue 30 Oct 2007, 03:35:08
Excellent graphs do wish however they included air transport.
Employed senior
- Blacksmith
- Heavy Crude
- Posts: 1064
- Joined: Sun 13 May 2007, 03:00:00
- Location: Athabasca, Alberta
Re: what's more oil intensive: a mile of highway or train tr
![]() by MrBill » Wed 31 Oct 2007, 07:26:48
by MrBill » Wed 31 Oct 2007, 07:26:48
In N. Alberta they are still ripping up the railway tracks for a lot of spur railway lines. They are too expensive to maintain at the moment. It is unclear what will happen to the railway rights of way? In most cases they are being preserved for public use. That may be important if and when we someday need to replace those rail lines. It is much easier when it is public land and it is already there even if the railway beds need to be upgraded.
This is somewhat an issue of main rail lines versus branch rail lines. The reality is that it will never be cost effective to service every little town by rail. Rail is most cost effective when it supports large volumes of frieght over long distances. So a small town may uneconomical to service, in which case public or private buses are the prefered method of transport. Along with distribution points for freight or goods.
Germany is roughly half the size of Alberta, but has a population of 82 million versus that of Alberta of about 3 million. Alberta is landlocked while Germany has both ports and internal waterways for transport. Even still Germany builds roads for transport and goods distribution. That might reflect public subsidies, but it may also simply mean that transport fuel, and therefore choice and flexibility, is still far too cheap to lure motorists out of their cars or freight off the highway and onto rail.
Those economics will no doubt change going forward as we experience both physical shortages of transport fuel and higher prices for all energy. But you will still need roads to link travel between rail and ports as well as into the countryside away from main lines. What is clear is that maintaining that transport network will become more expensive in real terms as energy becomes more expensive and/or there are shortages. That may limit or eliminate discretionary travel and therefore undermine popular support for public subsidies.
The organized state is a wonderful invention whereby everyone can live at someone else's expense.
-

MrBill - Expert
- Posts: 5630
- Joined: Thu 15 Sep 2005, 03:00:00
- Location: Eurasia
Return to Open Topic Discussion
Who is online
Users browsing this forum: No registered users and 1 guest