The $64 Trillion QuestionProduction by the (2005) Top 33 net exporters was up slightly from 2005 to 2012, but their increasing consumption caused their net exports (what I call Global Net Exports of oil, or GNE) in 2012 to be below 2005, with a sizable rate of decline in their ECI Ratio (ratio of production to consumption).
Furthermore, because of rapid increases in oil consumption by China & India (“Chindia”), what I define as Available Net Exports (ANE or GNE less Chindia’s Net Imports, or CNI) fell much more rapidly than GNE.
What happens from 2012 to 2022 is what I call the “$64 Trillion Question.”
Here are the 2012 values for the Top 33 net exporters in 2005, along with 2005 to 2012 rates of change (total petroleum liquids + other liquids, EIA, for net exports):
Production: 63 mbpd (+0.3%/year)
Consumption: 19 mbpd (+2.2%/year)
Net Exports: 44 mbpd (-0.5%/year)
Chindia’s Net Imports in 2012 and 2005 to 2012 rate of increase:
8.8 mbpd (+8.7%/year)
ANE (GNE less CNI) in 2012 and 2005 to 2012 rate of change:
35 mbpd (-2.3%/year)
If we assume that Top 33 production falls at 1.0%/year from 2012 to 2022 and if we assume that consumption continues to increase at the same rate (2.2%/year), GNE in 2022 would be down to 33 mbpd, almost a 3%/year rate of decline. Given this decline rate, unless Chindia’s consumption of GNE falls at 3%/year, or more, the resulting rate of decline in ANE will exceed the GNE decline rate, and the ANE decline rate will accelerate with time.
For example, let’s assume that Chindia’s rate of increase in net imports falls to 5%/year (versus 8.7%/year from 2005 to 2012). Their net imports in 2022 would be up to about 15 mbpd. ANE would be 33 (GNE) – 15 (CNI) = 18 mbpd (ANE), approximately a 50% reduction in the volume of Global Net Exports of oil available to about 155 net oil importing countries (versus 35 mbpd in 2012 and versus 41 mbpd in 2005). The 2012 to 2022 rate of decline in ANE would be 6.6%/year.
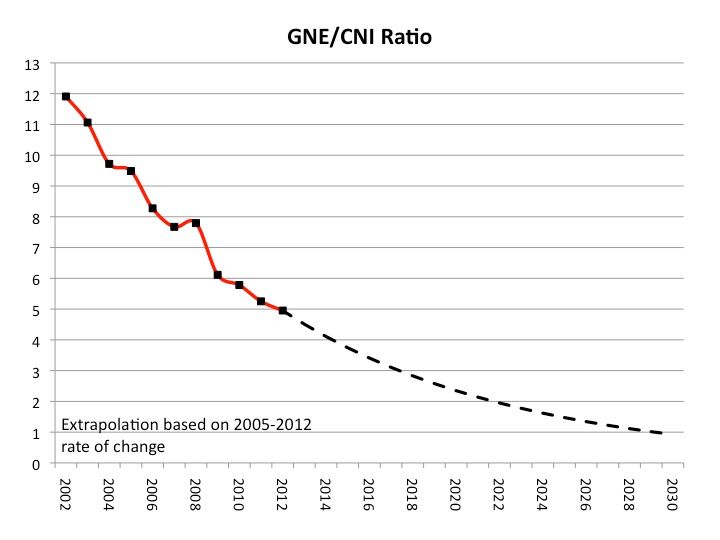
Here is what happened from 2002 to 2012 in regard to the ratio of Global Net Exports of oil (GNE) to Chindia's Net Imports (CNI). At a GNE/CNI Ratio of 1.0, the volume of Global Net Exports of oil available to about 155 net importing countries would theoretically be zero. Note that the above described scenario would put the GNE/CNI Ratio at about 2.2 in 2022.