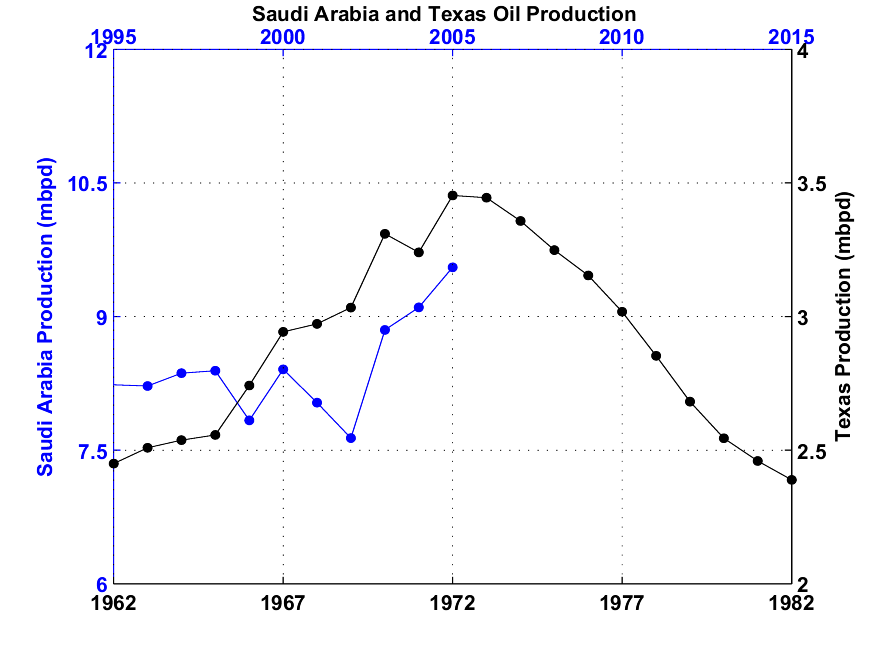
As Pops noted, the (so far) Texas peak in 1972 of about 3.4 mbpd was crude oil only (generally defined as 45 or lower API gravity crude oil). The Texas RRC data put the 2013 Texas condensate to C+C ratio at about 15%. If we apply this to the EIA C+C estimate for Texas, it implies that 2013 annual Texas crude oil production was about 2.2 mbpd. But of course, Texas is still on an upward trajectory in 2014, however, the rebound in Texas production--like the US overall--is built on the foundation of very high, and rising, underlying decline rates. I suspect that the underlying decline rate from existing Texas oil wells is at least 15%/year now, which would imply that the industry has to replace current 2014 Texas crude oil production in about seven years, just to maintain current production for seven years.
In any case, it's one of life's little ironies that the Cornucopians are using the examples of what are (so far) still post-crude oil peak producing regions, Texas and the US overall, to refute the Peak Oil "Theory."
Incidentally, regarding the Saudi C+C versus Texas crude only chart (which I believe was prepared in 2006), at the 2002 to 2005 rate of increase in annual Saudi C+C production (from 7.6 to 9.6 mbpd), Saudi Arabia would have been at about 18 mbpd in 2013. Saudi average production for 2006 to 2013 inclusive was 9.1 mbpd, although they did slightly exceed the 2005 C+C production rate in 2012 (at 9.8 mbpd, with an average rate of 9.7 for 2011 to 2013). However, the BP data show that 2013 was the eighth straight year in a row that Saudi net oil exports were below their 2005 net export rate of 9.1 mbpd (total petroleum liquids).
So to summarize:
Although currently rebounding, Texas and the US in 2013 were below their prior crude oil production peaks, with very high--and increasing--underlying decline rates.
Saudi Arabia averaged 9.1 mbpd (C+C) for 2006 to 2013 inclusive, versus 9.6 mbpd in 2005 (although the average for 2011, 2012 and 2013 was 9.7), but Saudi net exports in 2013 remained well below their 2005 annual rate.
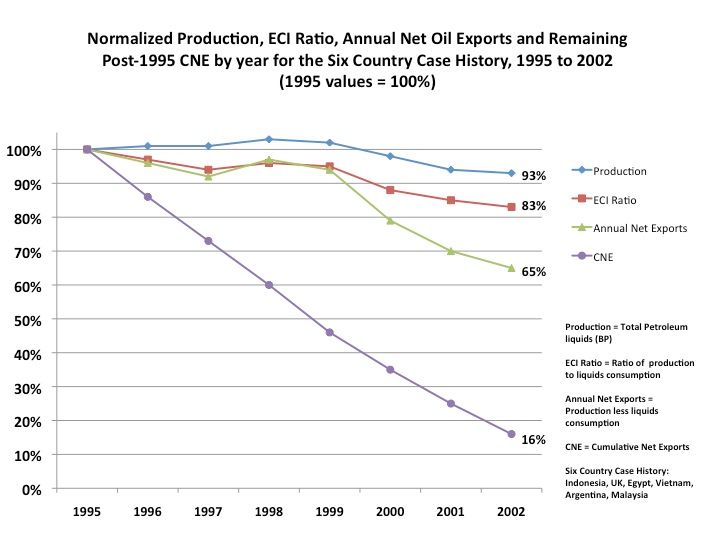
Meanwhile, CNE (Cumulative Net Exports) depletion marches on. The BP data suggest that the Saudi ECI Ratio (Ratio of production consumption) in 2013 was down to about 66% of the 2005 value. Note that the Remaining post-2005 CNE by year are estimated, based on the 2005 to 2012 rate of decline in the Saudi ECI Ratio. Also, note that at the 2002 to 2005 rate of increase in Saudi total petroleum liquids + other liquids production, they would have been at 171% of 2005 production in 2012.
 http://i1095.photobucket.com/albums/i47 ... 963fe3.jpg
Following is a similar chart for normalized Six Country values (1995 = 100%). These are the major net oil exporters that hit or approached zero net exports from 1980 to 2010 inclusive, excluding China. Note that as production rose slightly from 1995 to 1999, they had already shipped 54% of post-1995 CNE (Cumulative Net Exports). Note the correlation between a declining ECI Ratio and CNE depletion for the Six Country Case History, versus the observed decline in the Saudi ECI Ratio.