PeakOil is You
ASPO-USA circling the same drain as TOD?
Re: ASPO-USA and the future of "peak oil"
![]() by Loki » Sat 14 Sep 2013, 23:14:29
by Loki » Sat 14 Sep 2013, 23:14:29
$this->bbcode_second_pass_quote('JanLarsMueller', 'T')he simple fact is that the term "peak oil" has worn out much of its usefulness and become a liability.
No. Heroic efforts to maintain flat global production in the face of historically high prices does not mean the concept of peak oil has worn out its usefulness. On the contrary, it suggests peak oil is now.
That said, PO is just one piece of the puzzle. The lasting peak oil voices (Kunstler, Heinberg, Martenson, PO.com, Greer, Orlov, Foss, et al.) have taken a broad view of the Long Decline, encompassing not just energy, but environment, politics, economics, sociology, technology, longue duree history, etc.
But this does not negate the importance of peak oil. Did I mention peak oil is now? You should be trumpeting that fact.
Pops,

A garden will make your rations go further.
-

Loki - Expert

- Posts: 3509
- Joined: Sat 08 Apr 2006, 03:00:00
- Location: Oregon
Re: ASPO-USA circling the same drain as TOD?
![]() by westexas » Sun 15 Sep 2013, 08:42:24
by westexas » Sun 15 Sep 2013, 08:42:24
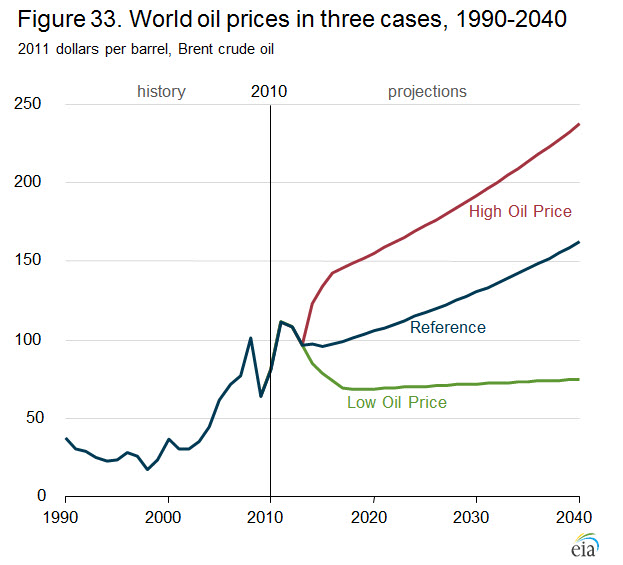
The long term (1930 to 2005) and 2002 to 2005 rates of increase in global C+C production were about the same, on the order of about 3%/year. "Gap" Charts for Global C+C and for Global Net Exports (total petroleum liquids + other liquids) follow, showing the gaps between where we would have been at the 2002 to 2005 rates of increase versus actual post-2005 data, by year. Of course, annual Brent crude oil prices approximately doubled from $25 in 2002 to $55 in 2005, and then doubled again, from $55 in 2005 to $112 in 2012 (with one year over year annual decline, in 2009).
Note that I estimate that we have already burned through about one-fifth of post-2005 Global CNE (Cumulative Net Exports). A similar extrapolation for the Six Country Case History* produced a post-1995 CNE estimate that was too optimistic.


*Six major net exporters, excluding China, that hit or approached zero net exports from 1980 to 2010.
Link to ECI article and excerpt from same:
http://www.resilience.org/stories/2013- ... city-index
$this->bbcode_second_pass_quote('', 'W')e know what the six year ECI decline meant for the Six Country Case History, and we know that we are seeing similar ECI type declines for Saudi Arabia, Global Net Exports and Available Net Exports.
The key question is why would the outcome for global net exports be materially different from the Six Country outcome?
My basic premise is that the net oil importing OECD countries are maintaining something resembling “Business As Usual” only because of huge and almost totally overlooked rates of depletion in post-2005 Global and Available Cumulative Net Exports of oil.
Note that I estimate that we have already burned through about one-fifth of post-2005 Global CNE (Cumulative Net Exports). A similar extrapolation for the Six Country Case History* produced a post-1995 CNE estimate that was too optimistic.
*Six major net exporters, excluding China, that hit or approached zero net exports from 1980 to 2010.
Link to ECI article and excerpt from same:
http://www.resilience.org/stories/2013- ... city-index
$this->bbcode_second_pass_quote('', 'W')e know what the six year ECI decline meant for the Six Country Case History, and we know that we are seeing similar ECI type declines for Saudi Arabia, Global Net Exports and Available Net Exports.
The key question is why would the outcome for global net exports be materially different from the Six Country outcome?
My basic premise is that the net oil importing OECD countries are maintaining something resembling “Business As Usual” only because of huge and almost totally overlooked rates of depletion in post-2005 Global and Available Cumulative Net Exports of oil.
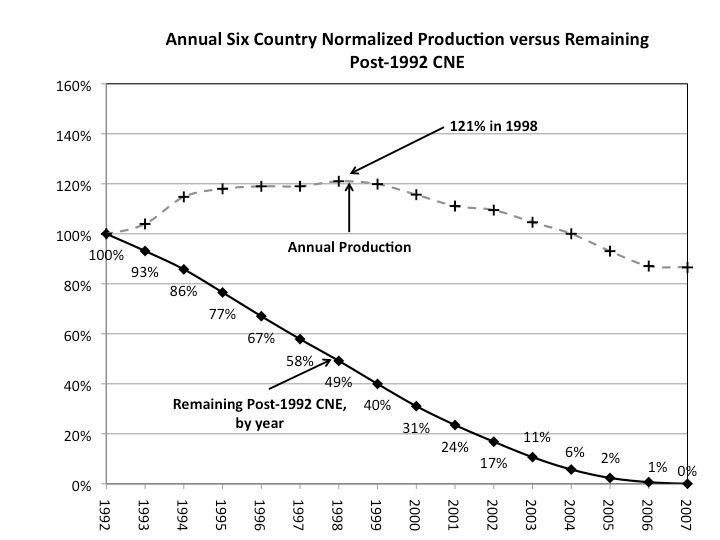
And a Six Country example of production versus CNE depletion:
(Post-1992 production as a percentage of 1992 production, versus remaining post-1992 CNE, by year)
Last edited by westexas on Sun 15 Sep 2013, 09:46:43, edited 3 times in total.
- westexas
- Expert
- Posts: 248
- Joined: Tue 04 Jun 2013, 06:59:53
Re: ASPO-USA circling the same drain as TOD?
![]() by ROCKMAN » Sun 15 Sep 2013, 09:04:05
by ROCKMAN » Sun 15 Sep 2013, 09:04:05
Sam - I agree. It's so unfortunate that so much focus was given to production rates and a relatively meaningless PO date. Everyone here understands the critical aspect is the cost/availability of energy. Even now it seems like there's still insufficient focus on the impact of higher oil costs. Consider how many more MSM stories there are today about increasing US oil production compared to the economic impact of the higher oil prices that have created that production increase. Great: we are producing more oil today than we were in 2002. And the American consumer is spending over $300 billion MORE for oil now. I wouldn't consider that a reason to smile with regards to our efforts to achieve "energy independence".
"Peak oil" was a handy term that many latched on to quickly back in the day. Now we just have to live with it and the misdirection of the conversation it's producing these days.
"Peak oil" was a handy term that many latched on to quickly back in the day. Now we just have to live with it and the misdirection of the conversation it's producing these days.
-

ROCKMAN - Expert
- Posts: 11397
- Joined: Tue 27 May 2008, 03:00:00
- Location: TEXAS
Re: ASPO-USA circling the same drain as TOD?
![]() by SeaGypsy » Sun 15 Sep 2013, 09:23:35
by SeaGypsy » Sun 15 Sep 2013, 09:23:35
$this->bbcode_second_pass_quote('ROCKMAN', '
')"Peak oil" was a handy term that many latched on to quickly back in the day. Now we just have to live with it and the misdirection of the conversation it's producing these days.
')"Peak oil" was a handy term that many latched on to quickly back in the day. Now we just have to live with it and the misdirection of the conversation it's producing these days.
Huh? Peak oil is a fact. When is debatable and the dynamic is as complex as the society developed around the finite product. Still a fact, not just a 'handy term'. Peak oil isn't 'misdirecting the conversation' other interests are doing that. Sure a lot of folks got it wrong and still do- doesn't change the fact.
- SeaGypsy
- Master Prognosticator

- Posts: 9285
- Joined: Wed 04 Feb 2009, 04:00:00
Re: ASPO-USA and the future of "peak oil"
![]() by Pops » Sun 15 Sep 2013, 15:37:45
by Pops » Sun 15 Sep 2013, 15:37:45
So Jan and I talked a little (PMed anyway) and I get the idea he thinks we're being overly sensitive. So I deleted the spamish portion of his post and brought it back up, sorta-speak. I'm sure you all can find a way to donate if you are determined, lol, but of course preventing that was not the point.
Someone else PMed me and told me I shouldn't lump all TOD articles together as just about flow rates or PO dates, there was lots of other stuff talked about there. OK.
Here's my point: nothing essential about peak oil has changed aside from the PR battle and that was never a contest. I wrote our primer in '04 saying there is by definition a beginning and an end to extraction of any finite resource, at some point reaching a maximum flow rate followed by decline.
Nothing about that basic premise has changed, as Loki and Dude said, it looks more and more like PO all the time. Sure some predictions have proved accurate while many, on all sides, have not, which is par in the future guessing business.
Perhaps Jan will forgive me for my snark, perhaps not. Regardless I am proud of and very protective of the effort spent here by our members to shed light on the subject this last decade. We are the not the influential but that's why I like us!
.
The legitimate object of government, is to do for a community of people, whatever they need to have done, but can not do, at all, or can not, so well do, for themselves -- in their separate, and individual capacities.
-- Abraham Lincoln, Fragment on Government (July 1, 1854)
-- Abraham Lincoln, Fragment on Government (July 1, 1854)
-

Pops - Elite
- Posts: 19746
- Joined: Sat 03 Apr 2004, 04:00:00
- Location: QuikSac for a 6-Pac
Re: ASPO-USA circling the same drain as TOD?
![]() by ROCKMAN » Sun 15 Sep 2013, 16:42:52
by ROCKMAN » Sun 15 Sep 2013, 16:42:52
SG - last time I looked a "term" is a word or collection of words. It's neither a fact or theory...just a term.
What's allowing the conversation to be misdirected is the counterargument that increased production, at least in the US, is "proof" that the concept of PO, at least in the short to midterm is incorrect...maybe forever for the dumbest out there. Most here know that this isn't a valid argument. But I'm not talking about usins here being misdirected but the vast majority of our citizens who ain't us. They are constantly inundated with "we are producing a lot more oil...no worries". You, me and most of the rest here know that's BS.
What's really frustrating is how little credit the increase in the price of oil is given to the situation. "We" ain't gonna convince the public by yelling "PO" in the theater and get folks heading for the exit by explaining the inevitability of PO while they daily read about the drilling boom in the US. As some folks have pointed out the web searches for "peak oil" have declined significantly. Tell me: out side of here and other similar ties how often do you see or hear any mention of 'PO'? Unfortunately I don't think 'POD' will turn into much of a rallying cry either.
We have ample proof that political policies tend to follow the common emotions of the electorate. You don't see much rhetoric about importing oil other then we are importing less. So yeah for us...no worries. And we are increasing domestic production...tens of thousands of wells to be drilled in the Balkan and Eagle Ford. So yeah for us...no worries. And we have so much NG we are exporting it. So yeah for us...no worries. And the Canadians are rapidly expanding the development our "North American" oil sands. So yeah for us...no worries. And the gov't has mandated better fuel economy and more biofuels production. So yeah for us...no worries. And the world will start developing their shale plays soon. So yeah or us...no worries. And big DW GOM fields with billions of bbls of oil are being discovered all the time. So yeah or us...no worries. And let's not forget those many billion of bbls of oil reserves being developed in Iraq and offshore Brazil. So yeah for us...no worries. And then there are those tens of billion of bbls of oil they'll soon be getting out of the Green River Shale. So yeah for us...no worries. Etc, etc, etc.
And so what are we going to do: step in front of that speeding train fill of oil drunk folks and hold up a white poster with the words "PEAK OIL...THE END IS NEAR" stenciled on it and expect them to hit the air breaks?
OK amigo...you first. LOL. IMHO we're not going to get any traction with THE TERM peak oil until we have another crisis. Which most will blame on something other than PO...at least for a while. "PO" is 2000ish. Get over it. LOL.
-
ROCKMAN - Expert
- Posts: 11397
- Joined: Tue 27 May 2008, 03:00:00
- Location: TEXAS
Re: ASPO-USA circling the same drain as TOD?
![]() by dorlomin » Sun 15 Sep 2013, 17:10:31
by dorlomin » Sun 15 Sep 2013, 17:10:31
$this->bbcode_second_pass_quote('ROCKMAN', '
')OK amigo...you first. LOL. IMHO we're not going to get any traction with THE TERM peak oil until we have another crisis. Which most will blame on something other than PO...at least for a while. "PO" is 2000ish. Get over it. LOL.
')OK amigo...you first. LOL. IMHO we're not going to get any traction with THE TERM peak oil until we have another crisis. Which most will blame on something other than PO...at least for a while. "PO" is 2000ish. Get over it. LOL.
Peak oil is causing a massive panic in the halls of power in the UK these days.
Offcourse is not called peak oil, its called North Sea output decline, loss of tax revenue and "oh god oh god oh god oh god please let fracking work here pleaaaaaaaaaaaaaaaaaaaaase".
Nebraskian spam not withstanding.
-

dorlomin - Light Sweet Crude

- Posts: 5193
- Joined: Sun 05 Aug 2007, 03:00:00