

PeakOil is You
Catalog of recent oil discoveries pt 3
Re: Catalog of recent oil discoveries pt 2
![]() by dinopello » Thu 03 Jan 2013, 16:44:09
by dinopello » Thu 03 Jan 2013, 16:44:09
$this->bbcode_second_pass_quote('pstarr', 'P')eak oil is real. Oil reservoirs deplete and so production declines and eventually ends. This will happen to each well, every group of wells, field, region, nation, and finally the planet. There may be drops left, but not economic to drill. Our industrial infrastructure and economic system depends on inexpensive oil.
Back to basics ! The other important thing to understand is constant rate growth.
It's perhaps a nit, but talking about oil 'production' confuses people. Oil 'extraction' would make it clearer what's going on.
-

dinopello - Light Sweet Crude

- Posts: 6088
- Joined: Fri 13 May 2005, 03:00:00
- Location: The Urban Village
Re: Catalog of recent oil discoveries pt 2
![]() by Quinny » Thu 03 Jan 2013, 18:00:40
by Quinny » Thu 03 Jan 2013, 18:00:40
Even given a following wind, the 'catalog' doesn't significantly alleviate the problems caused by the predicament we are in.
Live, Love, Learn, Leave Legacy.....oh and have a Laugh while you're doing it!
-

Quinny - Intermediate Crude

- Posts: 3337
- Joined: Thu 03 Jul 2008, 03:00:00
Re: Catalog of recent oil discoveries pt 2
![]() by SamInNebraska » Thu 03 Jan 2013, 21:06:33
by SamInNebraska » Thu 03 Jan 2013, 21:06:33
$this->bbcode_second_pass_quote('pstarr', 'P')eak oil is real. Oil reservoirs deplete and so production declines and eventually ends. This will happen to each well, every group of wells, field, region, nation, and finally the planet. There may be drops left, but not economic to drill. Our industrial infrastructure and economic system depends on inexpensive oil. You must understand this unless of course you are a proponent of abiotic oil?
Of course peak oil is real. What does that have to do with the "politics of peak oil"?
$this->bbcode_second_pass_quote('pstarr', '
')
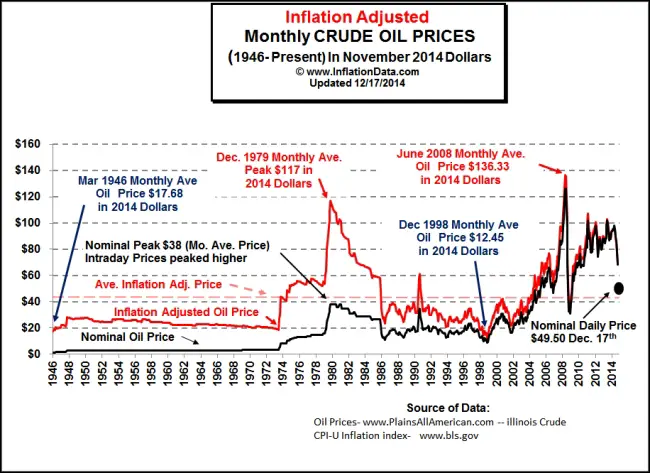
The national average price for gas in 2012 was $3.60 per gallon, which is the most expensive annual average on record. The previous annual record was $3.51 a gallon set in 2011, while the third most expensive year for gas prices nationwide was 2008, when the average was $3.25 per gallon.
Spot a trend?
Yes. Current prices are going down. And apparently car buyers are noticing as well.
http://www.freep.com/article/20130103/B ... nav%7Chead
But this isn't the topic, the oil discoveries which you appear to be implying allow this type of purchasing to continue,however, are.
- SamInNebraska
- Lignite

- Posts: 313
- Joined: Sun 14 Oct 2012, 23:05:58
Re: Catalog of recent oil discoveries pt 2
![]() by SamInNebraska » Thu 03 Jan 2013, 21:08:45
by SamInNebraska » Thu 03 Jan 2013, 21:08:45
$this->bbcode_second_pass_quote('pstarr', '')$this->bbcode_second_pass_quote('SamInNebraska', '
')
Interesting. How do we know this? it would seem easy enough to check, do we have any domain tracking software available to show that no .gov, or .citibank, or .doe domains come here?
we did check. it is crap.')
Interesting. How do we know this? it would seem easy enough to check, do we have any domain tracking software available to show that no .gov, or .citibank, or .doe domains come here?
What is crap? The idea that anyone with a .gov or .doe domain has ever checked the site just to see what is going on, or the ability to check for that type of information?
- SamInNebraska
- Lignite
- Posts: 313
- Joined: Sun 14 Oct 2012, 23:05:58


