


PeakOil is You
The Fallacy of predicting production
The Fallacy of predicting production
![]() by AirlinePilot » Tue 28 Feb 2012, 02:51:53
by AirlinePilot » Tue 28 Feb 2012, 02:51:53
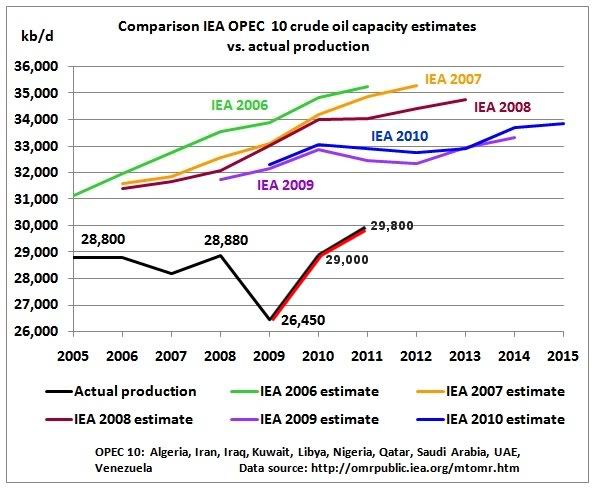
This is the ugly skeleton in the closet that no one seems to want to talk about, especially the cornies. The IEA, and just about every other industry driven analysis agency seems to not have been doing a very good job at foretelling the future. Seems that each year things trend a bit more towards reality, but I would submit they STILL look a bit rosy when it comes to the reality of C&C production.
-

AirlinePilot - Moderator

- Posts: 4378
- Joined: Tue 05 Apr 2005, 03:00:00
- Location: South of Atlanta
Re: The Fallacy of predicting production
![]() by AirlinePilot » Tue 28 Feb 2012, 02:59:43
by AirlinePilot » Tue 28 Feb 2012, 02:59:43
Here is one for OPEC......

-
AirlinePilot - Moderator
- Posts: 4378
- Joined: Tue 05 Apr 2005, 03:00:00
- Location: South of Atlanta
Re: The Fallacy of predicting production
![]() by SeaGypsy » Tue 28 Feb 2012, 03:08:25
by SeaGypsy » Tue 28 Feb 2012, 03:08:25
Funny that after how ever many decades of supposed free press and a decade of internet everywhere, still there is no major credible prediction agency. This seems to indicate collusion on behalf of oil majors and the Agencies reporting this nonsense ad-infinitum; more likely though a product of wishful thinking and real diversification.$this->bbcode_second_pass_quote('AirlinePilot', 'H')ere is one for OPEC......
- SeaGypsy
- Master Prognosticator

- Posts: 9285
- Joined: Wed 04 Feb 2009, 04:00:00
Re: The Fallacy of predicting production
![]() by AirlinePilot » Tue 28 Feb 2012, 03:21:56
by AirlinePilot » Tue 28 Feb 2012, 03:21:56
The reason Im pointing this out is simple. We continue to see people post here showing charts and graphs which Include reports and predictions from these "credible" agencies which support that global crude production is climbing. Total Liquids are, but barely. The FACTS support something else cocnerning CRUDE. This is after all a Peak oil website and understanding why predictions can be flawed is very pertinent to understanding oil depletion. Its an attempt to make people THINK and find out information for themselves without the bias of a preconceived belief based on FLAWED assumptions. This same meme holds true for former PEAK OIL and decline predictions and its why it is important to realize that as the future unfolds it is key to understand that its ok to evolve hypothesis surrounding this discussion.
I tweaked that chart to show the last two years of OPEC numbers, its still pretty far off. if you go find the charts for NON OPEC numbers its just as silly.
I tweaked that chart to show the last two years of OPEC numbers, its still pretty far off. if you go find the charts for NON OPEC numbers its just as silly.
-
AirlinePilot - Moderator
- Posts: 4378
- Joined: Tue 05 Apr 2005, 03:00:00
- Location: South of Atlanta
Re: The Fallacy of predicting production
![]() by AirlinePilot » Tue 28 Feb 2012, 03:27:03
by AirlinePilot » Tue 28 Feb 2012, 03:27:03
For those of us who have been following this CLOSELY for the last 7-8 years, its become obvious that the industry, and most probably governments too, drive the numbers in these reports a bit more than reality would suggest.
-
AirlinePilot - Moderator
- Posts: 4378
- Joined: Tue 05 Apr 2005, 03:00:00
- Location: South of Atlanta
Re: The Fallacy of predicting production
![]() by Pops » Tue 28 Feb 2012, 08:45:34
by Pops » Tue 28 Feb 2012, 08:45:34
This is my new favorite chart:

It shows capacity instead of production so it takes out lots of the short term political and price noise. It's like unfocusing you eyes to see a pattern.
Capacity grew like the dickens till 1980, was flat till '94 then resumed growing at a shallower but constant rate. Likewise, consumption grew quickly till the first yellow bubble in the '70s then dropped back and resumed growing at a slower but still constant rate. We talk about the drop in OECD demand as if it is a big deal but it is hardly noticeable.
From this view it seems inevitable that consumption would intersect with capacity somewhere in the area of the second bubble without increased capacity or decreased demand - the boom in Chinese chachkas moved the date up. As we all know, when spare capacity is that slim the markets get nervous. The other thing that strikes me is just how constant the growth has been over the 3 decades and how little capacity has moved from it's trendline regardless of all the happytalk.
We all know the IEA and EIA, not to mention IHS have been using the green line to make their forecasts, not the red one.
The legitimate object of government, is to do for a community of people, whatever they need to have done, but can not do, at all, or can not, so well do, for themselves -- in their separate, and individual capacities.
-- Abraham Lincoln, Fragment on Government (July 1, 1854)
-- Abraham Lincoln, Fragment on Government (July 1, 1854)
-

Pops - Elite

- Posts: 19746
- Joined: Sat 03 Apr 2004, 04:00:00
- Location: QuikSac for a 6-Pac
Re: The Fallacy of predicting production
![]() by TheAntiDoomer » Tue 28 Feb 2012, 09:14:52
by TheAntiDoomer » Tue 28 Feb 2012, 09:14:52
"The Fallacy of Predicting Production" have you sent that meme to Stuart Staniford yet? 

AP, you missed out on your internet hat thread
AP, you missed out on your internet hat thread
"The human ability to innovate out of a jam is profound.That’s why Darwin will always be right, and Malthus will always be wrong.” -K.R. Sridhar
Do I make you Corny?
"expect 8$ gas on 08/08/08" - Prognosticator
Do I make you Corny?
"expect 8$ gas on 08/08/08" - Prognosticator
-

TheAntiDoomer - Heavy Crude

- Posts: 1556
- Joined: Wed 18 Jun 2008, 03:00:00
Re: The Fallacy of predicting production
![]() by Kristen » Tue 28 Feb 2012, 11:34:05
by Kristen » Tue 28 Feb 2012, 11:34:05
If we build more refineries, would production increase?
-

Kristen - Tar Sands

- Posts: 711
- Joined: Mon 17 Jul 2006, 03:00:00
- Location: Minneapolis, Minnesota
Re: The Fallacy of predicting production
![]() by copious.abundance » Tue 28 Feb 2012, 16:28:52
by copious.abundance » Tue 28 Feb 2012, 16:28:52
I could not agree more about the fallacy of predicting oil production. 
Stuff for doomers to contemplate:
http://peakoil.com/forums/post1190117.html#p1190117
http://peakoil.com/forums/post1193930.html#p1193930
http://peakoil.com/forums/post1206767.html#p1206767
http://peakoil.com/forums/post1190117.html#p1190117
http://peakoil.com/forums/post1193930.html#p1193930
http://peakoil.com/forums/post1206767.html#p1206767
-

copious.abundance - Fission

- Posts: 9589
- Joined: Wed 26 Mar 2008, 03:00:00
- Location: Cornucopia
Re: The Fallacy of predicting production
![]() by kublikhan » Tue 28 Feb 2012, 17:30:56
by kublikhan » Tue 28 Feb 2012, 17:30:56
$this->bbcode_second_pass_quote('SeaGypsy', 'F')unny that after how ever many decades of supposed free press and a decade of internet everywhere, still there is no major credible prediction agency. This seems to indicate collusion on behalf of oil majors and the Agencies reporting this nonsense ad-infinitum; more likely though a product of wishful thinking and real diversification.
I think we can apply Hanlon's razor to the issue of failed predictions: Never attribute to malice that which is adequately explained by stupidity.
It is not easy predicting the future, so many variables to consider. Cornies, Doomers, and supposedly neutral agencies have all made bad guesses of future crude production. I do not attribute massive blame against these people making guesses about the future. They are just that, guesses. I always found it funny when people get all excited when their opponent guessed wrong.
"OMG, your oracle was WWWAAAAAYYY OFF!! You guys obviously know nothing!!!"
The oil barrel is half-full.
-

kublikhan - Master Prognosticator
- Posts: 5064
- Joined: Tue 06 Nov 2007, 04:00:00
- Location: Illinois
Re: The Fallacy of predicting production
![]() by SeaGypsy » Tue 28 Feb 2012, 18:54:45
by SeaGypsy » Tue 28 Feb 2012, 18:54:45
Yeah, well I have kicked all their asses the last 2 years, we'll see if that continues. I am a slow crasher, consider myself neutral and have no vested interest in the market (besides likely starving to death like the rest of us when it's game over). I don't think any of the major predictors have these 'qualities'.
- SeaGypsy
- Master Prognosticator
- Posts: 9285
- Joined: Wed 04 Feb 2009, 04:00:00
Re: The Fallacy of predicting production
![]() by Plantagenet » Tue 28 Feb 2012, 19:03:52
by Plantagenet » Tue 28 Feb 2012, 19:03:52
$this->bbcode_second_pass_quote('Kristen', 'I')f we build more refineries, would production increase?
Only if we also build another earth for the refineries to get more crude oil from----the production from this earth is about maxed out.
-

Plantagenet - Expert
- Posts: 26765
- Joined: Mon 09 Apr 2007, 03:00:00
- Location: Alaska (its much bigger than Texas).
Re: The Fallacy of predicting production
![]() by AirlinePilot » Wed 29 Feb 2012, 01:18:09
by AirlinePilot » Wed 29 Feb 2012, 01:18:09
$this->bbcode_second_pass_quote('AirlinePilot', ' ')This same meme holds true for former PEAK OIL and decline predictions and its why it is important to realize that as the future unfolds it is key to understand that its ok to evolve hypothesis surrounding this discussion.
OF,
Did you not see my acknowledgment ^^^^^^^^ that this goes both ways? The important point for all of us is not to be drawn completely into one side of an argument and become completely invested emotionally and intellectually. It destroys your ability to reason out changes as they occur. And Im the first to acknowledge that I changed my tune a few years back due to it. I was far more a "doomer" then, than I am now. I am firmly in the "we are screwed" camp, but more in a slow motion stair step down way than any fast crash die off scenario. I never embraced that despite a lot of mis-characterizations which seem always rampant here.
-
AirlinePilot - Moderator
- Posts: 4378
- Joined: Tue 05 Apr 2005, 03:00:00
- Location: South of Atlanta


